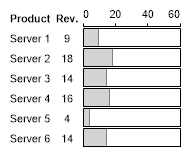
Gallery
Info Grid 2
<%@ Page Language="C#" Description="dotnetCHARTING Component" %>
<%@ Register TagPrefix="dotnet" Namespace="dotnetCHARTING" Assembly="dotnetCHARTING" %>
<%@ Import Namespace="System.Drawing" %>
<%@ Import Namespace="System.Drawing.Drawing2D" %>
<%@ Import Namespace="dotnetCHARTING.Mapping" %>
<script runat="server">
void Page_Load(Object sender, EventArgs e)
{
// Demonstrates how to set up an infoGrid using MicroCharts and data from a Series object.
Chart.TempDirectory = "temp";
Chart.Debug = true;
Chart.Mentor = false;
Chart.Size = "200x200";
Chart.ObjectChart = new dotnetCHARTING.Label(getGridText(getRandomData()));
}
string getGridText(Series s)
{
StringBuilder sb = new StringBuilder();
string lStyle = "<block hAlign='Center' vAlign='Center'>";
string hStyle = "<block fStyle='Bold' vAlign='Center'>";
// Headder
sb.Append(hStyle + "Product" + hStyle + "Rev.<Chart:Scale min='0' max='60'>");
// Each row
foreach (Element e in s.Elements)
sb.Append("<row>" + lStyle + e.Name + lStyle + e.YValue + "<Chart:Bar min='0' max='60' value='" + e.YValue + "'>");
return sb.ToString();
}
Series getRandomData()
{
Random myR = new Random();
Series s = new Series("");
for (int b = 1; b < 7; b++)
{
Element e = new Element("Server " + b.ToString());
e.YValue = myR.Next(50);
s.Elements.Add(e);
}
return s;
}
SeriesCollection getLiveData()
{
DataEngine de = new DataEngine("ConnectionString goes here");
de.ChartObject = Chart; // Necessary to view any errors the dataEngine may throw.
de.SqlStatement = "SELECT XAxisColumn, YAxisColumn FROM ....";
return de.GetSeries();
}
</script>
<html xmlns="http://www.w3.org/1999/xhtml">
<head>
<title>.netCHARTING Sample</title>
</head>
<body>
<div align="center">
<dotnet:Chart ID="Chart" runat="server" />
</div>
</body>
</html>
<%@ Page Language="vb" Description="dotnetCHARTING Component" %>
<%@ Register TagPrefix="dotnet" Namespace="dotnetCHARTING" Assembly="dotnetCHARTING" %>
<%@ Import Namespace="System.Drawing" %>
<%@ Import Namespace="System.Drawing.Drawing2D" %>
<%@ Import Namespace="dotnetCHARTING.Mapping" %>
<script runat="server">
Sub Page_Load(ByVal sender As Object, ByVal e As EventArgs)
' Demonstrates how to set up an infoGrid using MicroCharts and data from a Series object.
Chart.TempDirectory = "temp"
Chart.Debug = True
Chart.Mentor = False
Chart.Size = "200x200"
Chart.ObjectChart = New dotnetCHARTING.Label(getGridText(getRandomData()))
End Sub
Function getGridText(ByVal s As Series) As String
Dim sb As StringBuilder = New StringBuilder()
Dim lStyle As String = "<block hAlign='Center' vAlign='Center'>"
Dim hStyle As String = "<block fStyle='Bold' vAlign='Center'>"
' Headder
sb.Append(hStyle & "Product" & hStyle & "Rev.<Chart:Scale min='0' max='60'>")
' Each row
For Each e As Element In s.Elements
sb.Append("<row>" & lStyle & e.Name & lStyle & e.YValue & "<Chart:Bar min='0' max='60' value='" & e.YValue & "'>")
Next e
Return sb.ToString()
End Function
Function getRandomData() As Series
Dim myR As Random = New Random()
Dim s As Series = New Series("")
For b As Integer = 1 To 6
Dim e As Element = New Element("Server " & b.ToString())
e.YValue = myR.Next(50)
s.Elements.Add(e)
Next b
Return s
End Function
Function getLiveData() As SeriesCollection
Dim de As DataEngine = New DataEngine("ConnectionString goes here")
de.ChartObject = Chart ' Necessary to view any errors the dataEngine may throw.
de.SqlStatement = "SELECT XAxisColumn, YAxisColumn FROM ...."
Return de.GetSeries()
End Function
</script>
<html xmlns="http://www.w3.org/1999/xhtml">
<head>
<title>.netCHARTING Sample</title>
</head>
<body>
<div align="center">
<dotnet:Chart ID="Chart" runat="server" />
</div>
</body>
</html>
- Sample FilenameInfoGrid2.aspx
- Version5.2
- Uses DatabaseNo