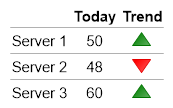
<%@ Page Language="C#" Description="dotnetCHARTING Component" %><%@ Register TagPrefix="dotnet" Namespace="dotnetCHARTING" Assembly="dotnetCHARTING" %><%@ Import Namespace="System.Drawing" %><%@ Import Namespace="System.Drawing.Drawing2D" %><%@ Import Namespace="dotnetCHARTING.Mapping" %><script runat="server"> void Page_Load(Object sender, EventArgs e) { // Demonstrates how to set up an infoGrid using MicroChart markers. Chart.TempDirectory = "temp"; Chart.Debug = true; Chart.Mentor = false; string gridText = "<block><block fStyle='Bold'>Today<block fStyle='Bold'>Trend<HR>"; gridText += "Server 1<block hAlign='Center'>50<Chart:Marker type='Triangle' Color='Green'>"; gridText += "<hr>Server 2<block hAlign='Center'>48<Chart:Marker type='TriangleUpsideDown' Color='Red'>"; gridText += "<hr>Server 3<block hAlign='Center'>60<Chart:Marker type='Triangle' Color='Green'>"; Chart.ObjectChart = new dotnetCHARTING.Label(gridText,new Font("Arial", 11)); }</script><html xmlns="http://www.w3.org/1999/xhtml"><head> <title>.netCHARTING Sample</title></head><body> <div align="center"> <dotnet:Chart ID="Chart" runat="server" /> </div></body></html>
<%@ Page Language="vb" Description="dotnetCHARTING Component" %><%@ Register TagPrefix="dotnet" Namespace="dotnetCHARTING" Assembly="dotnetCHARTING" %><%@ Import Namespace="System.Drawing" %><%@ Import Namespace="System.Drawing.Drawing2D" %><%@ Import Namespace="dotnetCHARTING.Mapping" %><script runat="server"> Sub Page_Load(ByVal sender As Object, ByVal e As EventArgs) ' Demonstrates how to set up an infoGrid using MicroChart markers. Chart.TempDirectory = "temp" Chart.Debug = True Chart.Mentor = False Dim gridText As String = "<block><block fStyle='Bold'>Today<block fStyle='Bold'>Trend<HR>" gridText &= "Server 1<block hAlign='Center'>50<Chart:Marker type='Triangle' Color='Green'>" gridText &= "<hr>Server 2<block hAlign='Center'>48<Chart:Marker type='TriangleUpsideDown' Color='Red'>" gridText &= "<hr>Server 3<block hAlign='Center'>60<Chart:Marker type='Triangle' Color='Green'>" Chart.ObjectChart = New dotnetCHARTING.Label(gridText,New Font("Arial", 11)) End Sub</script><html xmlns="http://www.w3.org/1999/xhtml"><head> <title>.netCHARTING Sample</title></head><body> <div align="center"> <dotnet:Chart ID="Chart" runat="server" /> </div></body></html>