Gallery
Image Bar
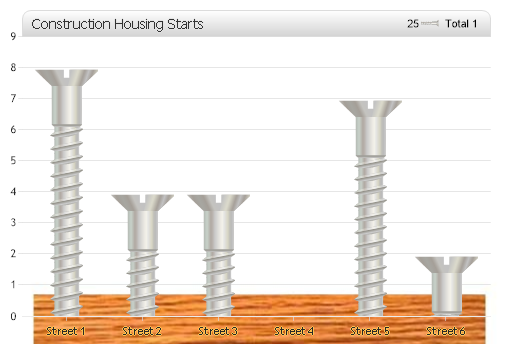
Demonstrates image bars, title box customization, image background and axis label outline usage.
- Sample FilenameImageBar.aspx
- Version4.0
- Uses DatabaseNo