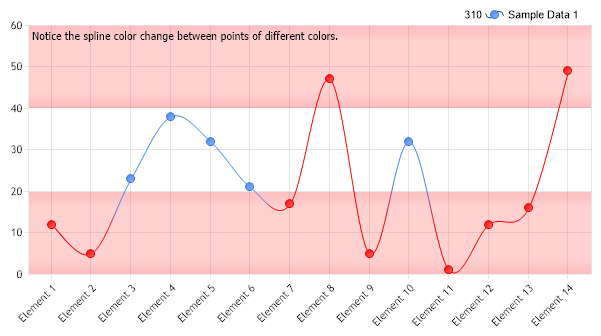
// Set some chart properties. Chart.ChartArea.Label.Text = "Notice the spline color change between points of different colors."; Chart.DefaultSeries.Type = SeriesType.Spline; Chart.TitleBox.Position = TitleBoxPosition.FullWithLegend;
// *DYNAMIC DATA NOTE* // This sample uses random data to populate the chart. To populate // a chart with database data see the following resources: // - Classic samples folder // - Help File > Data Tutorials // - Sample: features/DataEngine.aspx SeriesCollection mySC = getRandomData();
// Iterate the elements and set the color to red if an elements YValue is outside the 20-40 range. foreach(Element myE in mySC[0].Elements) if(myE.YValue > 40 || myE.YValue < 20) myE.Color = Color.Red;
// Add the random data. Chart.SeriesCollection.Add(mySC); }
SeriesCollection getRandomData() { SeriesCollection SC = new SeriesCollection(); Random myR = new Random(1); for(int a = 1; a < 2; a++) { Series s = new Series(); s.Name = "Sample Data " + a.ToString(); for(int b = 1; b < 15; b++) { Element e = new Element(); e.Name = "Element " + b.ToString(); e.YValue = myR.Next(50); s.Elements.Add(e); } SC.Add(s); }
' Set some chart properties. Chart.ChartArea.Label.Text = "Notice the spline color change between points of different colors." Chart.DefaultSeries.Type = SeriesType.Spline Chart.TitleBox.Position = TitleBoxPosition.FullWithLegend
' *DYNAMIC DATA NOTE* ' This sample uses random data to populate the chart. To populate ' a chart with database data see the following resources: ' - Classic samples folder ' - Help File > Data Tutorials ' - Sample: features/DataEngine.aspx Dim mySC As SeriesCollection = getRandomData()
' Iterate the elements and set the color to red if an elements YValue is outside the 20-40 range. For Each myE As Element In mySC(0).Elements If myE.YValue > 40 OrElse myE.YValue < 20 Then myE.Color = Color.Red End If Next myE
' Add the random data. Chart.SeriesCollection.Add(mySC) End Sub
Function getRandomData() As SeriesCollection Dim SC As SeriesCollection = New SeriesCollection() Dim myR As Random = New Random(1) For a As Integer = 1 To 1 Dim s As Series = New Series() s.Name = "Sample Data " & a.ToString() For b As Integer = 1 To 14 Dim e As Element = New Element() e.Name = "Element " & b.ToString() e.YValue = myR.Next(50) s.Elements.Add(e) Next b SC.Add(s) Next a
' ' ' '
Return SC End Function </script> </head> <body> <div style="text-align:center"> <dotnet:Chart id="Chart" runat="server" Width="568px" Height="344px"> </dotnet:Chart> </div> </body> </html>