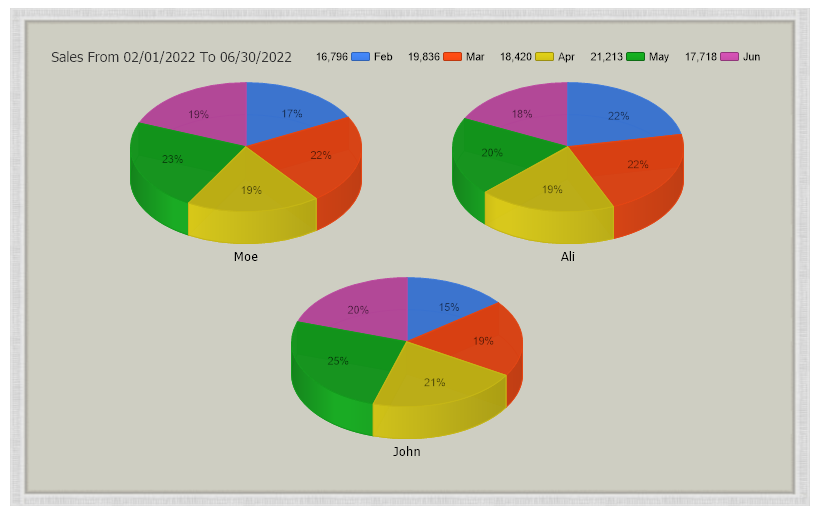
Gallery
Floating Pie
<%@ Page Language="C#" Description="dotnetCHARTING Component"%>
<%@ Register TagPrefix="dotnet" Namespace="dotnetCHARTING" Assembly="dotnetCHARTING"%>
<%@ Import Namespace="System.Drawing" %>
<script runat="server">
void Page_Load(Object sender,EventArgs e)
{
//set global properties
Chart.DefaultSeries.ConnectionString = ConfigurationManager.AppSettings["DNCConnectionString"];
Chart.Title="Sales";
Chart.Size="800x300";
Chart.Type = ChartType.Pies;
Chart.TempDirectory="temp";
Chart.Debug=true;
Chart.DefaultSeries.StartDate= new DateTime(2022,2,1,0,0,0);
Chart.DefaultSeries.EndDate = new DateTime(2022,6,30,23,59,59);
Chart.DateGrouping = TimeInterval.Months;
Chart.Use3D=true;
Chart.DefaultShadow.Color = Color.Transparent;
//Chart.LegendType = "WithValues";
Chart.Background = new Background("../../Images/border.gif",BackgroundMode.ImageStretch);
Chart.ChartArea.Background = new Background(Color.FromArgb(206,206,194));
Chart.Margin = "30";
Chart.Height = 498; //This is adjusted up from 480 for the sample to prevent the branded footer from covering the border.
Chart.TitleBox.Position = TitleBoxPosition.FullWithLegend;
Chart.TitleBox.ClearColors();
Chart.ChartArea.ClearColors();
//Add a series
Chart.Series.SqlStatement= @"SELECT OrderDate,Total, Name FROM Orders WHERE OrderDate >= #STARTDATE# AND OrderDate <= #ENDDATE# ORDER BY OrderDate";
Chart.DefaultSeries.DefaultElement.ShowValue=true;
Chart.Series.SplitByLimit="3";
Chart.SeriesCollection.Add();
}
</script>
<html xmlns="http://www.w3.org/1999/xhtml">
<head>
<title>Sales Report</title>
</head>
<body>
<div style="text-align:center">
<dotnet:Chart id="Chart" runat="server"/>
</div>
</body>
</html>
<%@ Page Language="vb" Description="dotnetCHARTING Component"%>
<%@ Register TagPrefix="dotnet" Namespace="dotnetCHARTING" Assembly="dotnetCHARTING"%>
<%@ Import Namespace="System.Drawing" %>
<script runat="server">
Sub Page_Load(ByVal sender As Object, ByVal e As EventArgs)
'set global properties
Chart.DefaultSeries.ConnectionString = ConfigurationManager.AppSettings("DNCConnectionString")
Chart.Title="Sales"
Chart.Size="800x300"
Chart.Type = ChartType.Pies
Chart.TempDirectory="temp"
Chart.Debug=True
Chart.DefaultSeries.StartDate= New DateTime(2022,2,1,0,0,0)
Chart.DefaultSeries.EndDate = New DateTime(2022,6,30,23,59,59)
Chart.DateGrouping = TimeInterval.Months
Chart.Use3D=True
Chart.DefaultShadow.Color = Color.Transparent
'Chart.LegendType = "WithValues";
Chart.Background = New Background("../../Images/border.gif",BackgroundMode.ImageStretch)
Chart.ChartArea.Background = New Background(Color.FromArgb(206,206,194))
Chart.Margin = "30"
Chart.Height = 498 'This is adjusted up from 480 for the sample to prevent the branded footer from covering the border.
Chart.TitleBox.Position = TitleBoxPosition.FullWithLegend
Chart.TitleBox.ClearColors()
Chart.ChartArea.ClearColors()
'Add a series
Chart.Series.SqlStatement= "SELECT OrderDate,Total, Name FROM Orders WHERE OrderDate >= #STARTDATE# AND OrderDate <= #ENDDATE# ORDER BY OrderDate"
Chart.DefaultSeries.DefaultElement.ShowValue=True
Chart.Series.SplitByLimit="3"
Chart.SeriesCollection.Add()
End Sub
</script>
<html xmlns="http://www.w3.org/1999/xhtml">
<head>
<title>Sales Report</title>
</head>
<body>
<div style="text-align:center">
<dotnet:Chart id="Chart" runat="server"/>
</div>
</body>
</html>
- Sample FilenamefloatingPie.aspx
- VersionLegacy (Pre 3.0)
- Uses DatabaseYes