Gallery
Color Pie Top Manually
<%@ Import Namespace="System.Drawing" %>
<%@ Register TagPrefix="dotnet" Namespace="dotnetCHARTING" Assembly="dotnetCHARTING" %>
<%@ Page Language="C#" Description="dotnetCHARTING Component" %>
<html>
<head>
<title>Gallery Sample (Time Gantt Chart in 2D)</title>
<script runat="server">
void Page_Load(Object sender, EventArgs e)
{
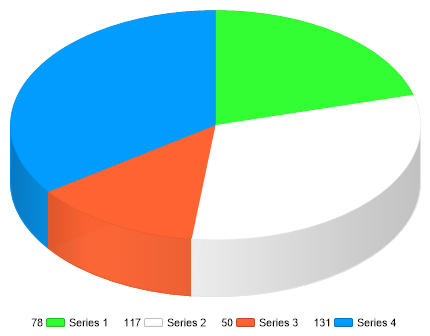
// Demonstrates how to manually create a single pie from multiple series using ChartType.Pies and how to color in the top of a 3D pie using the original colors so that 3D shading does not affect it.
Chart.TempDirectory = "temp";
Chart.Debug = true;
Chart.Palette = new Color[] { Color.FromArgb(49, 255, 49), Color.White, Color.FromArgb(255, 99, 49), Color.FromArgb(0, 156, 255) };
Chart.Type = ChartType.Pies;
Chart.Size = "600x350";
Chart.Use3D = true;
//Chart.Title = ".netCHARTING Sample";
// *DYNAMIC DATA NOTE*
// This sample uses random data to populate the chart. To populate
// a chart with database data see the following resources:
// - Help File > Getting Started > Data Tutorials
// - DataEngine Class in the help file
// - Sample: features/DataEngine.aspx
Series mySC = getSumSeries(getRandomData());
// Add the random data.
Chart.SeriesCollection.Add(mySC);
// Get a chart bitmap
Bitmap bmp = Chart.GetChartBitmap();
Graphics g = Graphics.FromImage(bmp);
g.SmoothingMode = System.Drawing.Drawing2D.SmoothingMode.HighQuality;
// Draw the element polygons.
int i = 0;
foreach (Element el in mySC.Elements)
{
using (Brush brush = new SolidBrush(Chart.Palette[i++]))
{
g.FillPolygon(brush, el.GetPolygon());
}
}
g.Dispose();
Chart.FileManager.SaveImage(bmp);
bmp.Dispose();
}
/// <summary>
/// Returns a single series where each element represents the sum of a current series.
/// </summary>
/// <param name="sc"></param>
/// <returns></returns>
Series getSumSeries(SeriesCollection sc)
{
if (sc.Count > 0)
{
Series myS = new Series();
foreach (Series s in sc)
{
myS.Elements.Add(s.Calculate(s.Name, Calculation.Sum));
}
return (myS);
}
else
return new Series();
}
SeriesCollection getRandomData()
{
Random myR = new Random(1);
SeriesCollection SC = new SeriesCollection();
for (int a = 1; a < 5; a++)
{
Series s = new Series("Series " + a.ToString());
for (int b = 1; b < 5; b++)
{
Element e = new Element("Element " + b.ToString());
e.YValue = myR.Next(50);
s.Elements.Add(e);
}
SC.Add(s);
}
return SC;
}
SeriesCollection getLiveData()
{
DataEngine de = new DataEngine("ConnectionString goes here");
de.ChartObject = Chart; // Necessary to view any errors the dataEngine may throw.
de.SqlStatement = "SELECT XAxisColumn, YAxisColumn FROM ....";
return de.GetSeries();
}
</script>
</head>
<body>
<asp:Label ID="label1" runat="server" />
<div align="center">
<dotnet:Chart ID="Chart" runat="server" />
</div>
</body>
</html>
<%@ Import Namespace="System.Drawing" %>
<%@ Register TagPrefix="dotnet" Namespace="dotnetCHARTING" Assembly="dotnetCHARTING" %>
<%@ Page Language="vb" Description="dotnetCHARTING Component" %>
<html>
<head>
<title>Gallery Sample (Time Gantt Chart in 2D)</title>
<script runat="server">
Sub Page_Load(ByVal sender As Object, ByVal e As EventArgs)
' This sample demonstrates how to manually create a single pie from multiple series using ChartType.Pies and how to color in the top of a 3D pie using the original colors so that 3D shading does not affect it.
Chart.TempDirectory = "temp"
Chart.Debug = True
Chart.Palette = New Color() { Color.FromArgb(49, 255, 49), Color.White, Color.FromArgb(255, 99, 49), Color.FromArgb(0, 156, 255) }
Chart.Type = ChartType.Pies
Chart.Size = "600x350"
Chart.Use3D = True
Chart.Title = ".netCHARTING Sample"
' *DYNAMIC DATA NOTE*
' This sample uses random data to populate the chart. To populate
' a chart with database data see the following resources:
' - Help File > Getting Started > Data Tutorials
' - DataEngine Class in the help file
' - Sample: features/DataEngine.aspx
Dim mySC As Series = getSumSeries(getRandomData())
' Add the random data.
Chart.SeriesCollection.Add(mySC)
' Get a chart bitmap
Dim bmp As Bitmap = Chart.GetChartBitmap()
Dim g As Graphics = Graphics.FromImage(bmp)
g.SmoothingMode = System.Drawing.Drawing2D.SmoothingMode.HighQuality
' Draw the element polygons.
Dim i As Integer = 0
For Each el As Element In mySC.Elements
Using brush As Brush = New SolidBrush(Chart.Palette(i))
i += 1
g.FillPolygon(brush, el.GetPolygon())
End Using
Next el
g.Dispose()
Chart.FileManager.SaveImage(bmp)
bmp.Dispose()
End Sub
' <summary>
' Returns a single series where each element represents the sum of a current series.
' </summary>
' <param name="sc"></param>
' <returns></returns>
Function getSumSeries(ByVal sc As SeriesCollection) As Series
If sc.Count > 0 Then
Dim myS As Series = New Series()
For Each s As Series In sc
myS.Elements.Add(s.Calculate(s.Name, Calculation.Sum))
Next s
Return (myS)
Else
Return New Series()
End If
End Function
Function getRandomData() As SeriesCollection
Dim myR As Random = New Random(1)
Dim SC As SeriesCollection = New SeriesCollection()
For a As Integer = 1 To 4
Dim s As Series = New Series("Series " & a.ToString())
For b As Integer = 1 To 4
Dim e As Element = New Element("Element " & b.ToString())
e.YValue = myR.Next(50)
s.Elements.Add(e)
Next b
SC.Add(s)
Next a
Return SC
End Function
Function getLiveData() As SeriesCollection
Dim de As DataEngine = New DataEngine("ConnectionString goes here")
de.ChartObject = Chart ' Necessary to view any errors the dataEngine may throw.
de.SqlStatement = "SELECT XAxisColumn, YAxisColumn FROM ...."
Return de.GetSeries()
End Function
</script>
</head>
<body>
<asp:Label ID="label1" runat="server" />
<div align="center">
<dotnet:Chart ID="Chart" runat="server" />
</div>
</body>
</html>
- Sample FilenameColorPieTopManually.aspx
- Version5.0
- Uses DatabaseNo