// Demonstrates using a custom brush with a background object.
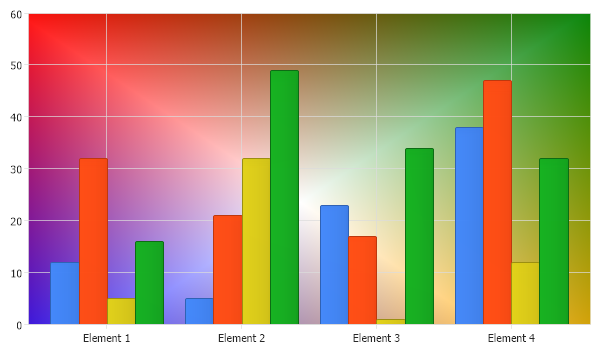
// Setup a PathGradient brush. GraphicsPath gp = new GraphicsPath(); gp.AddRectangle(new Rectangle(0,0,600,400)); PathGradientBrush pgb = new PathGradientBrush(gp); pgb.SurroundColors = new Color[]{Color.Red,Color.Green,Color.Orange,Color.Blue}; gp.Dispose();
// Create a new background object using the brush. Chart.ChartArea.Background = new Background(pgb); Chart.ChartArea.LegendBox.Visible = false; // *DYNAMIC DATA NOTE* // This sample uses random data to populate the chart. To populate // a chart with database data see the following resources: // - Classic samples folder // - Help File > Data Tutorials // - Sample: features/DataEngine.aspx SeriesCollection mySC = getRandomData();
// Add the random data. Chart.SeriesCollection.Add(mySC);
}
SeriesCollection getRandomData() { SeriesCollection SC = new SeriesCollection(); Random myR = new Random(1); for(int a = 1; a < 5; a++) { Series s = new Series(); s.Name = "Series " + a.ToString(); for(int b = 1; b < 5; b++) { Element e = new Element(); e.Name = "Element " + b.ToString(); e.YValue = myR.Next(50); s.Elements.Add(e); } SC.Add(s); }
' Demonstrates using a custom brush with a background object.
' Setup a PathGradient brush. Dim gp As GraphicsPath = New GraphicsPath() gp.AddRectangle(New Rectangle(0,0,600,400)) Dim pgb As PathGradientBrush = New PathGradientBrush(gp) pgb.SurroundColors = New Color(){Color.Red,Color.Green,Color.Orange,Color.Blue} gp.Dispose()
' Create a new background object using the brush. Chart.ChartArea.Background = New Background(pgb) Chart.ChartArea.LegendBox.Visible = False ' *DYNAMIC DATA NOTE* ' This sample uses random data to populate the chart. To populate ' a chart with database data see the following resources: ' - Classic samples folder ' - Help File > Data Tutorials ' - Sample: features/DataEngine.aspx Dim mySC As SeriesCollection = getRandomData()
' Add the random data. Chart.SeriesCollection.Add(mySC)
End Sub
Function getRandomData() As SeriesCollection Dim SC As SeriesCollection = New SeriesCollection() Dim myR As Random = New Random(1) For a As Integer = 1 To 4 Dim s As Series = New Series() s.Name = "Series " & a.ToString() For b As Integer = 1 To 4 Dim e As Element = New Element() e.Name = "Element " & b.ToString() e.YValue = myR.Next(50) s.Elements.Add(e) Next b SC.Add(s) Next a
Return SC End Function </script> </head> <body> <div style="text-align:center"> <dotnet:Chart id="Chart" runat="server" Width="568px" Height="344px"> </dotnet:Chart> </div> </body> </html>