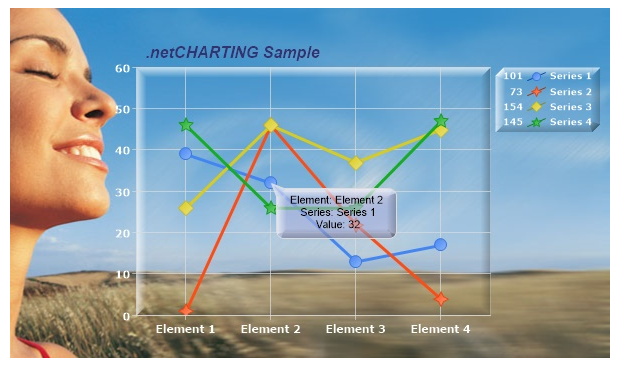
Bevel
Give your charts some style using the bevel effect.
<%@ Page Language="C#" Description="dotnetCHARTING Component" %>
<%@ Register TagPrefix="dotnet" Namespace="dotnetCHARTING" Assembly="dotnetCHARTING"%>
<%@ Import Namespace="System.Drawing" %>
<html xmlns="http://www.w3.org/1999/xhtml">
<head>
<title>.netCHARTING Sample</title>
<script runat="server">
void Page_Load(Object sender,EventArgs e)
{
// Demonstrates how to give your charts some style using the bevel effect.
Chart.Title = ".netCHARTING Sample";
Chart.Type = ChartType.Combo;//Horizontal;
Chart.Width = 600;
Chart.Height = 350;
Chart.TempDirectory = "temp";
Chart.ImageFormat = ImageFormat.Jpg;
Chart.FileQuality = 95;
Chart.Debug = true;
Chart.YAxis.Interval = 10;
// First we get our data, if you would like to get the data from a database you need to use
// the data engine. See sample: features/dataEngine.aspx. Or the dataEngine tutorial in the help file.
SeriesCollection mySC = getRandomData();
// Set a background image for the chart.
Chart.Background.ImagePath = "../../images/background.jpg";
// Make the default series a line so the image underneath can be seen better.
Chart.DefaultSeries.Type = SeriesType.Line;
// Give the lines some width
Chart.DefaultSeries.Line.Width = 3;
// Make the default element marker a bit bigger.
Chart.DefaultSeries.DefaultElement.Marker.Size = 12;
// White text will be more clear on this image so we apply it to the axis tick marks and make the font bigger.
Chart.DefaultAxis.DefaultTick.Label.Color = Color.White;
Chart.DefaultAxis.DefaultTick.Label.Font = new Font("Verdana", 8, FontStyle.Bold);
// Give the default axis grid lines a lighter color.
Chart.DefaultAxis.DefaultTick.GridLine.Color = Color.FromArgb(130, 200, 200, 200);
// Adjust the margins.
Chart.MarginTop = 20;
Chart.MarginBottom = 20;
Chart.MarginLeft = 100;
// XAxis labels
//Chart.XAxis.Label.Text = "Element Label";
// Make the legend box text stand out more with a lighter color and bolder font.
Chart.LegendBox.LabelStyle.Color = Color.White;
Chart.LegendBox.LabelStyle.Font = new Font("Verdana",7,FontStyle.Bold);
// Make the legend box transparent and ad a bevel effect so the outline can be seen.
Chart.LegendBox.ClearColors();
Chart.LegendBox.Background.Bevel = true;
// Make the title text stand out more.
Chart.TitleBox.Label.Font = new Font("Arial",12,FontStyle.Italic | FontStyle.Bold);
Chart.TitleBox.Label.Color = Color.FromArgb(53,50,111);
// Clear the title box colors to make it transparent.
Chart.TitleBox.ClearColors();
// Give the chart area transparent color and bevel it.
Chart.ChartArea.Background.Color = Color.Transparent;
Chart.ChartArea.Background.Bevel = true;
// Well also add an annotation to complete the look. See sample OnElementAnnotation.aspx for more info.
Annotation a = new Annotation("Element: %Name \n Series: %SeriesName \n Value: %YValue");
a.Background.Color = Color.FromArgb(150,180,180,220);
a.Background.Bevel = true;
a.Orientation = dotnetCHARTING.Orientation.BottomRight;
a.DefaultCorner = BoxCorner.Round;
a.Size = new Size(120,50);
mySC[0].Elements[1].Annotation = a;
// Add the random data.
Chart.SeriesCollection.Add(mySC);
}
SeriesCollection getRandomData()
{
SeriesCollection SC = new SeriesCollection();
Random myR = new Random();
for(int a = 1; a < 5; a++)
{
Series s = new Series();
s.Name = "Series " + a;
for(int b = 1; b < 5; b++)
{
Element e = new Element();
e.Name = "Element " + b;
//e.YValue = -25 + myR.Next(50);
e.YValue = myR.Next(50);
s.Elements.Add(e);
}
SC.Add(s);
}
return SC;
}
</script>
</head>
<body>
<div style="text-align:center">
<dotnet:Chart id="Chart" runat="server" Width="568px" Height="344px">
</dotnet:Chart>
</div>
</body>
</html>
<%@ Page Language="vb" Description="dotnetCHARTING Component" %>
<%@ Register TagPrefix="dotnet" Namespace="dotnetCHARTING" Assembly="dotnetCHARTING"%>
<%@ Import Namespace="System.Drawing" %>
<html xmlns="http://www.w3.org/1999/xhtml">
<head>
<title>.netCHARTING Sample</title>
<script runat="server">
Sub Page_Load(ByVal sender As Object, ByVal e As EventArgs)
' Demonstrates how to give your charts some style using the bevel effect.
Chart.Title = ".netCHARTING Sample"
Chart.Type = ChartType.Combo 'Horizontal;
Chart.Width = 600
Chart.Height = 350
Chart.TempDirectory = "temp"
Chart.ImageFormat = ImageFormat.Jpg
Chart.FileQuality = 95
Chart.Debug = True
Chart.YAxis.Interval = 10
' First we get our data, if you would like to get the data from a database you need to use
' the data engine. See sample: features/dataEngine.aspx. Or the dataEngine tutorial in the help file.
Dim mySC As SeriesCollection = getRandomData()
' Set a background image for the chart.
Chart.Background.ImagePath = "../../images/background.jpg"
' Make the default series a line so the image underneath can be seen better.
Chart.DefaultSeries.Type = SeriesType.Line
' Give the lines some width
Chart.DefaultSeries.Line.Width = 3
' Make the default element marker a bit bigger.
Chart.DefaultSeries.DefaultElement.Marker.Size = 12
' White text will be more clear on this image so we apply it to the axis tick marks and make the font bigger.
Chart.DefaultAxis.DefaultTick.Label.Color = Color.White
Chart.DefaultAxis.DefaultTick.Label.Font = New Font("Verdana", 8, FontStyle.Bold)
' Give the default axis grid lines a lighter color.
Chart.DefaultAxis.DefaultTick.GridLine.Color = Color.FromArgb(130, 200, 200, 200)
' Adjust the margins.
Chart.MarginTop = 20
Chart.MarginBottom = 20
Chart.MarginLeft = 100
' XAxis labels
'Chart.XAxis.Label.Text = "Element Label";
' Make the legend box text stand out more with a lighter color and bolder font.
Chart.LegendBox.LabelStyle.Color = Color.White
Chart.LegendBox.LabelStyle.Font = New Font("Verdana",7,FontStyle.Bold)
' Make the legend box transparent and ad a bevel effect so the outline can be seen.
Chart.LegendBox.ClearColors()
Chart.LegendBox.Background.Bevel = True
' Make the title text stand out more.
Chart.TitleBox.Label.Font = New Font("Arial",12,FontStyle.Italic Or FontStyle.Bold)
Chart.TitleBox.Label.Color = Color.FromArgb(53,50,111)
' Clear the title box colors to make it transparent.
Chart.TitleBox.ClearColors()
' Give the chart area transparent color and bevel it.
Chart.ChartArea.Background.Color = Color.Transparent
Chart.ChartArea.Background.Bevel = True
' Well also add an annotation to complete the look. See sample OnElementAnnotation.aspx for more info.
Dim a As Annotation = New Annotation("Element: %Name " & Constants.vbLf & " Series: %SeriesName " & Constants.vbLf & " Value: %YValue")
a.Background.Color = Color.FromArgb(150,180,180,220)
a.Background.Bevel = True
a.Orientation = dotnetCHARTING.Orientation.BottomRight
a.DefaultCorner = BoxCorner.Round
a.Size = New Size(120,50)
mySC(0).Elements(1).Annotation = a
' Add the random data.
Chart.SeriesCollection.Add(mySC)
End Sub
Function getRandomData() As SeriesCollection
Dim SC As SeriesCollection = New SeriesCollection()
Dim myR As Random = New Random()
For a As Integer = 1 To 4
Dim s As Series = New Series()
s.Name = "Series " & a
For b As Integer = 1 To 4
Dim e As Element = New Element()
e.Name = "Element " & b
'e.YValue = -25 + myR.Next(50);
e.YValue = myR.Next(50)
s.Elements.Add(e)
Next b
SC.Add(s)
Next a
Return SC
End Function
</script>
</head>
<body>
<div style="text-align:center">
<dotnet:Chart id="Chart" runat="server" Width="568px" Height="344px">
</dotnet:Chart>
</div>
</body>
</html>