Gallery
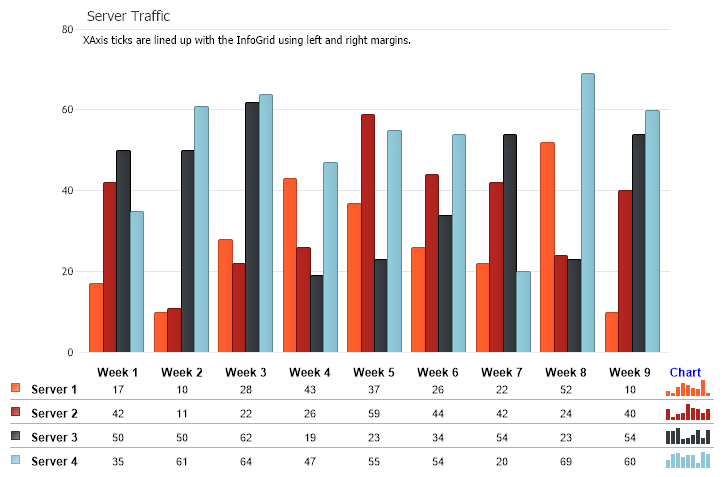
Legend Info Grid 2
<%@ Page Language="C#" Description="dotnetCHARTING Component" %>
<%@ Register TagPrefix="dotnet" Namespace="dotnetCHARTING" Assembly="dotnetCHARTING" %>
<%@ Import Namespace="System.Drawing" %>
<script runat="server">
void Page_Load(Object sender, EventArgs e)
{
// Demonstrates using an InfoGrid inside a legend box header.
Chart.TempDirectory = "temp";
Chart.Debug = true;
Chart.Type = ChartType.Combo;
Chart.Size = "730x500";
Chart.Title = "Server Traffic";
Chart.PaletteName = Palette.FiveColor31;
Chart.ChartArea.Label.Text = "XAxis ticks are lined up with the InfoGrid using left and right margins.";
Chart.XAxis.DefaultTick.Label.Font = new Font("Arial", 9, FontStyle.Bold);
Chart.MarginLeft = 60;
Chart.MarginRight = 53;
Chart.DefaultSeries.LegendEntry.Visible = false;
Chart.LegendBox.Shadow.Visible = false;
Chart.LegendBox.HeaderBackground.Color = Color.White;
Chart.XAxis.ClearValues = true;
Chart.LegendBox.Orientation = dotnetCHARTING.Orientation.Bottom;
// *DYNAMIC DATA NOTE*
// This sample uses random data to populate the chart. To populate
// a chart with database data see the following resources:
// - Use the getLiveData() method using the dataEngine to query a database.
// - Help File > Getting Started > Data Tutorials
// - DataEngine Class in the help file
// - Sample: features/DataEngine.aspx
SeriesCollection mySC = getRandomData();
string s = generateMarkup(mySC);
Chart.LegendBox.HeaderLabel.Text = s;
// Add the random data.
Chart.SeriesCollection.Add(mySC);
}
string generateMarkup(SeriesCollection sc)
{
// If all series dont have the same number of of elements it may break the InfoGrid so grouping them can help.
sc.GroupByElements();
// Define some block styles
string headerStyle = "<block fStyle='bold' fSize='9'>";
string headerStyle2 = "<block fStyle='bold' fSize='9' fColor='blue' hAlign='Left'>";
//string calculationStyle = "<block fStyle='italic' fSize='9'>";
string spacer = "<Chart:Spacer height='1' width='61'>";
StringBuilder sb = new StringBuilder();
// Add a series of spacers to define the width of each block when aligned.
sb.Append("<Chart:Spacer height='1' width='5'>" + spacer);
foreach (Element e in sc[0].Elements)
sb.Append(spacer);
sb.Append("<Chart:Spacer height='1' width='10'>");
// Add header titles in a similar fassion matching the final number of columns.
sb.Append("<row><block><block>");
foreach (Element e in sc[0].Elements)
sb.Append(headerStyle + e.Name);
sb.Append(headerStyle2 + " Chart");
// New Row
sb.Append("<row>");
// Now each row is populated with data.
int i = 0;
foreach (Series s in sc)
{
// A block using a marker micro chart for the series color and the series name. (2 blocks)
sb.Append("<Chart:Marker width='10' height='10' type='Square' Color='" + getHTMLColor(Chart.Palette[i]) + "'><block fStyle='bold' fSize='9'>" + s.Name);
// A block for each element
string valueList = "";
foreach (Element e in s.Elements)
{
sb.Append("<block>" + e.YValue);
//gather the values of each element for the micro column chart
valueList += e.YValue.ToString() + ",";
}
// Add the column micro chart.
sb.Append("<Chart:Column Color='" + getHTMLColor(Chart.Palette[i]) + "' values='" + valueList + "' max='100'>");
// Indicate that a new row should start but omit the last row which would start a new row with 0 blocks and cause the grid to misalign.
if (i++ < sc.Count - 1)
sb.Append("<hr>");
}
return sb.ToString();
}
/// <summary>
/// Helper method to turn a color object into HTML color format like #A0187E
/// </summary>
string getHTMLColor(Color c)
{
string col = c.R.ToString("X2") + c.G.ToString("X2") + c.B.ToString("X2");
return "#" + col;
}
SeriesCollection getRandomData()
{
Random myR = new Random(1);
SeriesCollection SC = new SeriesCollection();
int a = 0;
int b = 0;
for (a = 1; a < 5; a++)
{
Series s = new Series("Server " + a.ToString());
for (b = 1; b < 10; b++)
{
Element e = new Element("Week " + b.ToString());
e.YValue = myR.Next(50) + (a * 5);
s.Elements.Add(e);
}
SC.Add(s);
}
return SC;
}
SeriesCollection getLiveData()
{
DataEngine de = new DataEngine("ConnectionString goes here");
de.ChartObject = Chart; // Necessary to view any errors the dataEngine may throw.
de.SqlStatement = "SELECT XAxisColumn, YAxisColumn FROM ....";
return de.GetSeries();
}
</script>
<html xmlns="http://www.w3.org/1999/xhtml">
<head>
<title>.netCHARTING Sample</title>
</head>
<body>
<div align="center">
<dotnet:Chart ID="Chart" runat="server" />
</div>
</body>
</html>
<%@ Page Language="vb" Description="dotnetCHARTING Component" %>
<%@ Register TagPrefix="dotnet" Namespace="dotnetCHARTING" Assembly="dotnetCHARTING" %>
<%@ Import Namespace="System.Drawing" %>
<script runat="server">
Sub Page_Load(ByVal sender As Object, ByVal e As EventArgs)
' Demonstrates using an InfoGrid inside a legend box header.
Chart.TempDirectory = "temp"
Chart.Debug = True
Chart.Type = ChartType.Combo
Chart.Size = "730x500"
Chart.Title = "Server Traffic"
Chart.PaletteName = Palette.FiveColor31
Chart.ChartArea.Label.Text = "XAxis ticks are lined up with the InfoGrid using left and right margins."
Chart.XAxis.DefaultTick.Label.Font = New Font("Arial", 9, FontStyle.Bold)
Chart.MarginLeft = 60
Chart.MarginRight = 53
Chart.DefaultSeries.LegendEntry.Visible = False
Chart.LegendBox.Shadow.Visible = False
Chart.LegendBox.HeaderBackground.Color = Color.White
Chart.XAxis.ClearValues = True
Chart.LegendBox.Orientation = dotnetCHARTING.Orientation.Bottom
' *DYNAMIC DATA NOTE*
' This sample uses random data to populate the chart. To populate
' a chart with database data see the following resources:
' - Use the getLiveData() method using the dataEngine to query a database.
' - Help File > Getting Started > Data Tutorials
' - DataEngine Class in the help file
' - Sample: features/DataEngine.aspx
Dim mySC As SeriesCollection = getRandomData()
Dim s As String = generateMarkup(mySC)
Chart.LegendBox.HeaderLabel.Text = s
' Add the random data.
Chart.SeriesCollection.Add(mySC)
End Sub
Function generateMarkup(ByVal sc As SeriesCollection) As String
' If all series dont have the same number of of elements it may break the InfoGrid so grouping them can help.
sc.GroupByElements()
' Define some block styles
Dim headerStyle As String = "<block fStyle='bold' fSize='9'>"
Dim headerStyle2 As String = "<block fStyle='bold' fSize='9' fColor='blue' hAlign='Left'>"
'string calculationStyle = "<block fStyle='italic' fSize='9'>";
Dim spacer As String = "<Chart:Spacer height='1' width='61'>"
Dim sb As StringBuilder = New StringBuilder()
' Add a series of spacers to define the width of each block when aligned.
sb.Append("<Chart:Spacer height='1' width='5'>" & spacer)
For Each e As Element In sc(0).Elements
sb.Append(spacer)
Next e
sb.Append("<Chart:Spacer height='1' width='10'>")
' Add header titles in a similar fassion matching the final number of columns.
sb.Append("<row><block><block>")
For Each e As Element In sc(0).Elements
sb.Append(headerStyle & e.Name)
Next e
sb.Append(headerStyle2 & " Chart")
' New Row
sb.Append("<row>")
' Now each row is populated with data.
Dim i As Integer = 0
For Each s As Series In sc
' A block using a marker micro chart for the series color and the series name. (2 blocks)
sb.Append("<Chart:Marker width='10' height='10' type='Square' Color='" & getHTMLColor(Chart.Palette(i)) & "'><block fStyle='bold' fSize='9'>" & s.Name)
' A block for each element
Dim valueList As String = ""
For Each e As Element In s.Elements
sb.Append("<block>" & e.YValue)
'gather the values of each element for the micro column chart
valueList &= e.YValue.ToString() & ","
Next e
' Add the column micro chart.
sb.Append("<Chart:Column Color='" & getHTMLColor(Chart.Palette(i)) & "' values='" & valueList & "' max='100'>")
' Indicate that a new row should start but omit the last row which would start a new row with 0 blocks and cause the grid to misalign.
If i < sc.Count - 1 Then
sb.Append("<hr>")
End If
i = i + 1
Next s
Return sb.ToString()
End Function
''' <summary>
''' Helper method to turn a color object into HTML color format like #A0187E
''' </summary>
Function getHTMLColor(ByVal c As Color) As String
Dim col As String = c.R.ToString("X2") + c.G.ToString("X2") + c.B.ToString("X2")
Return "#" & col
End Function
Function getRandomData() As SeriesCollection
Dim myR As Random = New Random(1)
Dim SC As SeriesCollection = New SeriesCollection()
Dim a As Integer = 0
Dim b As Integer = 0
For a = 1 To 4
Dim s As Series = New Series("Server " & a.ToString())
For b = 1 To 9
Dim e As Element = New Element("Week " & b.ToString())
e.YValue = myR.Next(50) + (a * 5)
s.Elements.Add(e)
Next b
SC.Add(s)
Next a
Return SC
End Function
Function getLiveData() As SeriesCollection
Dim de As DataEngine = New DataEngine("ConnectionString goes here")
de.ChartObject = Chart ' Necessary to view any errors the dataEngine may throw.
de.SqlStatement = "SELECT XAxisColumn, YAxisColumn FROM ...."
Return de.GetSeries()
End Function
</script>
<html xmlns="http://www.w3.org/1999/xhtml">
<head>
<title>.netCHARTING Sample</title>
</head>
<body>
<div align="center">
<dotnet:Chart ID="Chart" runat="server" />
</div>
</body>
</html>
- Sample FilenameLegendInfoGrid2.aspx
- Version5.2
- Uses DatabaseNo