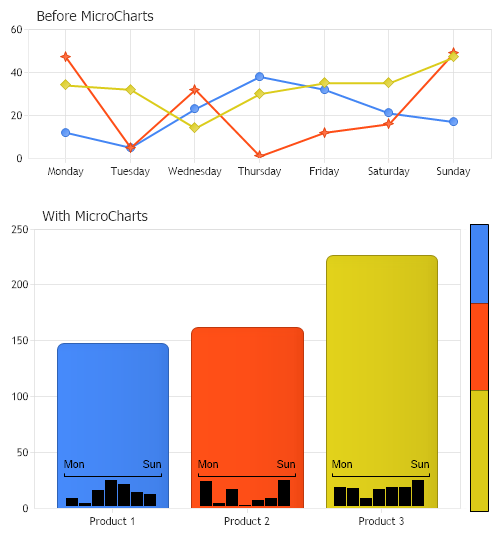
Gallery
Chart Micro Bar
<%@ Page Language="C#" Description="dotnetCHARTING Component" %>
<%@ Register TagPrefix="dotnet" Namespace="dotnetCHARTING" Assembly="dotnetCHARTING" %>
<%@ Import Namespace="System.Drawing" %>
<%@ Import Namespace="System.Drawing.Drawing2D" %>
<script runat="server">
void Page_Load(Object sender, EventArgs e)
{
// Demonstrates using MicroCharts on bar labels and axis labels to represent data in a more readable manner.
// Setup common settings
SetChart(Chart);
SetChart(Chart1);
Chart.Size = "500,200";
Chart.Title = "Before MicroCharts ";
Chart.DefaultSeries.Type = SeriesType.Line;
Chart.DefaultSeries.Line.Width = 2;
Chart.SeriesCollection.Add(getRandomData());
Chart1.PaletteName = Palette.Default;
Chart1.Title = "With MicroCharts";
Chart1.ChartArea.Label.Alignment = StringAlignment.Near;
// Set bar label options.
Chart1.DefaultElement.ShowValue = true;
Chart1.DefaultElement.SmartLabel.Alignment = LabelAlignment.Bottom;
Chart1.DefaultElement.SmartLabel.AlignmentSecondary[0] = LabelAlignment.Top;
// Get the same data as for the first chart.
SeriesCollection mySC = getRandomData();
// Transpose it to get a sum series (3 bars).
mySC.Transpose();
Series sum = mySC.Calculate("", Calculation.Sum);
// Color each bar separately.
sum.Palette = Chart1.Palette;
Chart1.SeriesCollection.Add(sum);
// Transpose it back.
mySC.Transpose();
// Set the label for each bar manualy getting the daily values from the original mySC collection.
int i = 0;
foreach (Element el in sum.Elements)
{
el.SmartLabel.Text = "<Chart:Scale values='Mon,Sun'><row><Chart:Column Color='black' height='30' values='" + mySC[i++].GetYValueList() + "' width='100'>";
}
// Setup a new y axis to display the BarFull microChart vertically.
Axis shadow = Chart1.YAxis.Calculate("");
shadow.Orientation = dotnetCHARTING.Orientation.Right;
shadow.Line.Color = Color.Transparent;
shadow.ClearValues = true;
shadow.DefaultTick.GridLine.Color = Color.Empty;
Chart1.AxisCollection.Add(shadow);
shadow.ExtraTicks.Add(new AxisTick(0, 250, "<Chart:BarFull size='290,20' values='" + sum.GetYValueList() + "'>"));
}
void SetChart(Chart c) // Shared chart settings.
{
c.Type = ChartType.Combo;
c.Size = "500x350";
c.TempDirectory = "temp";
//c.Debug = true;
c.LegendBox.Visible = false;
}
SeriesCollection getRandomData()
{
Random myR = new Random(1);
SeriesCollection SC = new SeriesCollection();
for (int a = 1; a < 4; a++)
{
Series s = new Series("Product " + a.ToString());
foreach( string day in new string[] { "Monday", "Tuesday", "Wednesday", "Thursday", "Friday", "Saturday", "Sunday"})
{
Element e = new Element(day);
e.YValue = myR.Next(50);
s.Elements.Add(e);
}
SC.Add(s);
}
return SC;
}
SeriesCollection getLiveData()
{
DataEngine de = new DataEngine("ConnectionString goes here");
de.ChartObject = Chart; // Necessary to view any errors the dataEngine may throw.
de.SqlStatement = "SELECT XAxisColumn, YAxisColumn FROM ....";
return de.GetSeries();
}
</script>
<html xmlns="http://www.w3.org/1999/xhtml">
<head>
<title>.netCHARTING Sample</title>
</head>
<body>
<div align="center">
<dotnet:Chart ID="Chart" runat="server" />
<dotnet:Chart ID="Chart1" runat="server" />
</div>
</body>
</html>
<%@ Page Language="vb" Description="dotnetCHARTING Component" %>
<%@ Register TagPrefix="dotnet" Namespace="dotnetCHARTING" Assembly="dotnetCHARTING" %>
<%@ Import Namespace="System.Drawing" %>
<%@ Import Namespace="System.Drawing.Drawing2D" %>
<script runat="server">
Sub Page_Load(ByVal sender As Object, ByVal e As EventArgs)
' Demonstrates using MicroCharts on bar labels and axis labels to represent data in a more readable manner.
' Setup common settings
SetChart(Chart)
SetChart(Chart1)
Chart.Size = "500,200"
Chart.Title = "Before MicroCharts "
Chart.DefaultSeries.Type = SeriesType.Line
Chart.DefaultSeries.Line.Width = 2
Chart.SeriesCollection.Add(getRandomData())
Chart1.PaletteName = Palette.Default
Chart1.Title = "With MicroCharts"
Chart1.ChartArea.Label.Alignment = StringAlignment.Near
' Set bar label options.
Chart1.DefaultElement.ShowValue = True
Chart1.DefaultElement.SmartLabel.Alignment = LabelAlignment.Bottom
Chart1.DefaultElement.SmartLabel.AlignmentSecondary(0) = LabelAlignment.Top
' Get the same data as for the first chart.
Dim mySC As SeriesCollection = getRandomData()
' Transpose it to get a sum series (3 bars).
mySC.Transpose()
Dim sum As Series = mySC.Calculate("", Calculation.Sum)
' Color each bar separately.
sum.Palette = Chart1.Palette
Chart1.SeriesCollection.Add(sum)
' Transpose it back.
mySC.Transpose()
' Set the label for each bar manualy getting the daily values from the original mySC collection.
Dim i As Integer = 0
For Each el As Element In sum.Elements
el.SmartLabel.Text = "<Chart:Scale values='Mon,Sun'><row><Chart:Column Color='black' height='30' values='" & mySC(i).GetYValueList() & "' width='100'>"
i += 1
Next el
' Setup a new y axis to display the BarFull microChart vertically.
Dim shadow As Axis = Chart1.YAxis.Calculate("")
shadow.Orientation = dotnetCHARTING.Orientation.Right
shadow.Line.Color = Color.Transparent
shadow.ClearValues = True
shadow.DefaultTick.GridLine.Color = Color.Empty
Chart1.AxisCollection.Add(shadow)
shadow.ExtraTicks.Add(New AxisTick(0, 250, "<Chart:BarFull size='290,20' values='" & sum.GetYValueList() & "'>"))
End Sub
Sub SetChart(ByVal c As Chart) ' Shared chart settings.
c.Type = ChartType.Combo
c.Size = "500x350"
c.TempDirectory = "temp"
'c.Debug = true;
c.LegendBox.Visible = False
End Sub
Function getRandomData() As SeriesCollection
Dim myR As Random = New Random(1)
Dim SC As SeriesCollection = New SeriesCollection()
For a As Integer = 1 To 3
Dim s As Series = New Series("Product " & a.ToString())
For Each day As String In New String() { "Monday", "Tuesday", "Wednesday", "Thursday", "Friday", "Saturday", "Sunday"}
Dim e As Element = New Element(day)
e.YValue = myR.Next(50)
s.Elements.Add(e)
Next day
SC.Add(s)
Next a
Return SC
End Function
Function getLiveData() As SeriesCollection
Dim de As DataEngine = New DataEngine("ConnectionString goes here")
de.ChartObject = Chart ' Necessary to view any errors the dataEngine may throw.
de.SqlStatement = "SELECT XAxisColumn, YAxisColumn FROM ...."
Return de.GetSeries()
End Function
</script>
<html xmlns="http://www.w3.org/1999/xhtml">
<head>
<title>.netCHARTING Sample</title>
</head>
<body>
<div align="center">
<dotnet:Chart ID="Chart" runat="server" />
<dotnet:Chart ID="Chart1" runat="server" />
</div>
</body>
</html>
- Sample FilenameChartMicroBar.aspx
- Version5.2
- Uses DatabaseNo