New in version 10.8

|
.NET 10.0 Chart Support.netCHARTING 10.8 introduces a .NET 10.0 chart nuget package and a .NET 10.0 chart sample bundle , both requiring Visual Studio 2026. With .NET 10.0, developers can enjoy simplified development, improved performance, and increased productivity. We remain committed to enhancing .netCHARTING by continuously adding value and functionality, ensuring compatibility with the latest Visual Studio 2026, Windows Server 2022, and .NET 10.0. |
New in version 10.7
|
.NET 9.0 Chart Support.netCHARTING 10.7 introduces a .NET 9.0 chart nuget package and a .NET 9.0 chart sample bundle , both requiring Visual Studio 2022. With .NET 9.0, developers can enjoy simplified development, improved performance, and increased productivity. We remain committed to enhancing .netCHARTING by continuously adding value and functionality, ensuring compatibility with the latest Visual Studio 2022, Windows Server 2022, and .NET 9.0. |
New in version 10.6
|
.NET 8.0 Chart Support.netCHARTING 10.6 adds both a .NET 8.0 chart nuget package and .NET 8.0 chart sample bundle (requires Visual Studio 2022) .NET 8.0 provides simplified development, better performance and enhanced productivity. We continue to add value and functionality to .netCHARTING maintaining the latest Visual Studio 2022, Windows Server 2022 and .NET 8.0 support. |
New in version 10.5
|
.NET 7 Chart Support.netCHARTING 10.5 supports the latest .NET release with both a .NET 7.0 chart nuget package and .NET 7.0 chart sample bundle. .NET 7 is the latest version of the .NET framework, bringing significant performance enhancements, improved developer productivity, and new features to empower developers in building modern and scalable applications. |
|
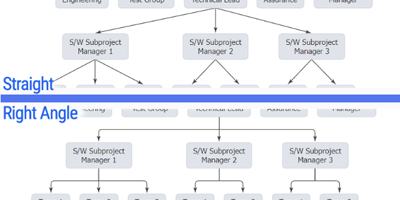
Right-angle or straight organizational connector linesWe enhanced how organizational connector lines appear by drawing them at right angles by default. You can use the straight option to change this default and draw connector lines directly between points. |

|
Synchronize organizational node widths and heightsWe added Element.Annotation.SyncWidth and SyncHeight properties to help you control the sizing and visual balance of organizational chart nodes. |

|
Point hierarchy connector styling and selectionThere is now a way to select specific branches in an organizational or Gantt dependency chart using hierarchy path selectors. You can select all branches from a given point up the hierarchy, down the hierarchy, both up and down, or between two points. |

|
New connector line radius optionWe added a connector line radius property (DefaultElement.CornerRadius) to control the rounded corners of organizational connector and Gantt dependency lines. |
|
Corner radius control for column and bar chartsThe new DefaultElement.CornerRadius property can be used to control column and bar corner radius rounding. |
|
Enable Axis.TickNumberMaximum to work with JavaScript chartsIt is now simple to control the number of automatically generated axis ticks on a JavaScript chart using this new property. |
|
Grid line alignment enhancementsWe added Axis.CenterTickMarks support for JavaScript chart ranges axis enabling a grid line to center on a range tick. |

|
Improved Shape Label PositioningWe completed a significant overhaul of the shape label positioning algorithm to handle many labels in different positions accurately. |
|
Improvements to multiple gauge layoutWe enhanced the way multiple gauges and radars are laid out on a chart to make better use of the available space. |

|
Automatic string animations when charts update.When chart label text changes, the text will animate between the old and new value for both numbers and words, to indicate a change is taking place. |
|
New Series.DefaultLeafElement PropertyTo help you work more efficiently with hierarchical charts, you can apply element options to only leaf elements (elements without any elements below them in the hierarchy). |

|
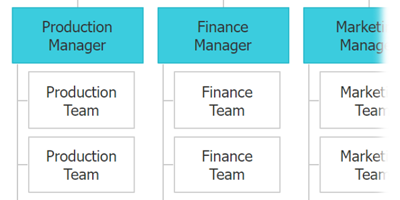
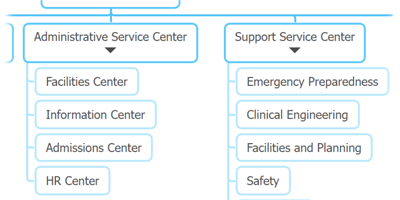
Automatic leaf element vertical layoutJavaScript organizational charts will now optimize organizational chart layouts by stacking leaf points vertically automatically. |
|
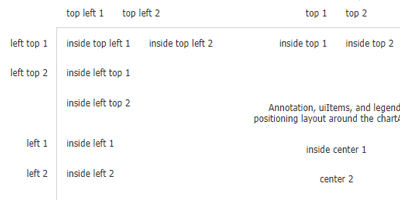
Advanced relative annotation positioningControl annotation positions with a simple string with combinations including top, center, bottom, inside, left and right. For example, "inside top left" would position in the top left corner, inside the chart area. |
|
Advanced LegendBox position support for JavaScript chartsLegend boxes now support the same advanced positioning syntax as annotations. For example: "inside left top" places the legend inside the chart area in the top left corner stacked vertically (notice the use of left top vs. top left here). |
|
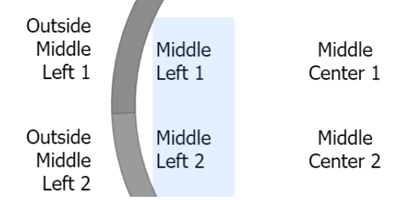
Added Label.Placement for use with shape label positions.Use this new property with shape labels to control whether to place labels inside or outside charts such as donuts and circular gauges. |
|
Added SmartLabel.PlacementTo provide better control over label placement, this new property specifies if labels display inside or outside element visuals. |
|
Ability to disable automatic label wrapping in JS chartsYou can now disable automatic label wrapping in all labels in JavaScript charts. |

|
Added label MaxWidth propertyWant to limit label width? Use the MaxWidth label option to reliably limit the width a label can be. Labels beyond the maximum width will wrap. |
|
Automatic label ellipsis text overflow supportWhen using MaxWidth and AutoWrapping=false, labels will automatically use overflow ellipsis and limit their size without wrapping text. |
|
Enable Chart.OverlapFooter to work with JS chartsEnabled for JavaScript charts, you can now design the chart while it shows branding and know that it will look and size the same once branding is removed. |
New in version 10.4

|
.NET 6.0 Chart Support.netCHARTING 10.4 adds both a .NET 6.0 chart nuget package and .NET 6.0 chart sample bundle (requires Visual Studio 2022), .NET 5 was the successor of .NET Core 3.1 and .NET Framework 4.8, aims to provide .NET developers with a new cross-platform development experience. .NET 6.0 expands on this with simplified development, better performance and enhanced productivity. We continue to add value and functionality to .netCHARTING maintaining the latest Visual Studio 2022, Windows Server 2022 and .NET 6.0 support. |
New in version 10.3

|
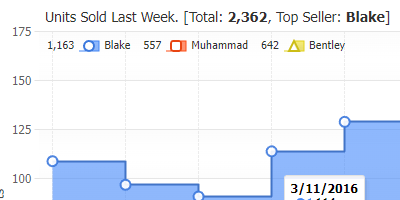
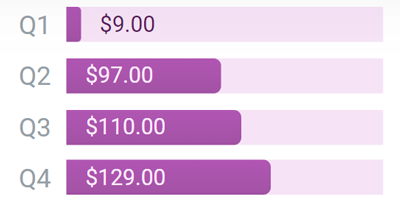
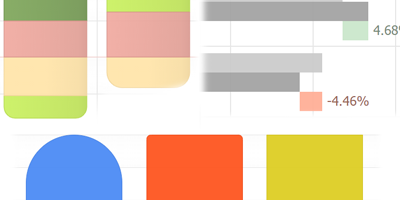
Automatic Column RoundingA major leap in aesthetics seamlessly maintained as your data changes, JavaScript charts will apply corner rounding to columns and bars at the appropriate edges automatically. No need to write code to avoid having notches between stacked items or any other problem scenarios. A visually pleasing corner radius is also automatically calculated to soften the column look regardless of size while being subtle enough not to interfere with reading specific chart values. |
|
|
Legend Line IconsLegend line icons are enhanced with the addition of dash styles and represent line series of varying widths and dash styles more accurately by scaling both attributes on the legend icon. |
|
Point RadiusYou can use the point.radius JS option property to disable corner rounding by setting a value of 0, or manually set a value to control the corner rounding to match the exact look you require. |
|
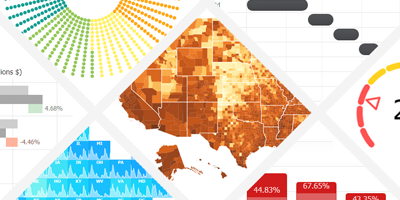
24 New Examples24 new examples have been added demonstrating a wide range of chart features and functionality that you can use as a starting point to chart you data. |
New in version 10.2
|
.NET 5.0 Chart SupportWe are proud to announce the first chart built with 100% managed code in .NET 5. .NET 5, the successor of .NET Core 3.1 and .NET Framework 4.8, aims to provide .NET developers with a new cross-platform development experience.We continue to add value and functionality to .netCHARTING maintaining the latest Visual Studio, Windows Server and .NET support. |
|
Windows, macOS and Linux Cross Platform SupportEasily work with .netCHARTING across differnet platforms along with .NET 5 now supported in Windows, macOS and Linux. Built with .NET 5 cross platform and provided with extensive samples, this high performance charting control also contains a feature rich data access and aggregation system with calculation support. |
|
ASP.NET MVC and Razor supportA dedicated MVC chart bundle is available to quickly get up and running. Integrate visualizations with projects using the technologies you require including MVC and Razor. |
New in version 10.1
|
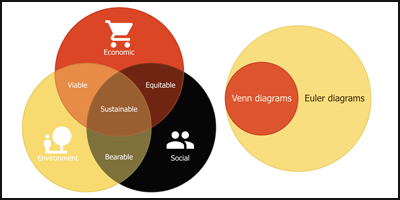
Venn and Euler DiagramsA new Venn and Euler diagram chart type has been added to JS charts. |
|
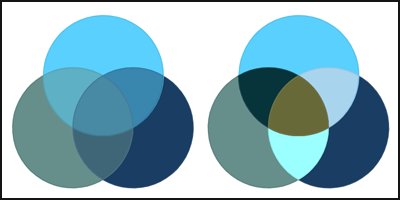
Automatic Venn Color BlendingUsing the default ChartType.Venn option, venn diagram elements that are made up of two or more overlapping shapes will blend the underlying colors. Using the ChartType.VennColorByPoint option will assign a unique color to each element. |

|
RTL Text support with JS ChartsThe JavaScript output now offers full right-to-left language support. The chart will automatically apply this feature when a RTL language culture string is specified. |

|
Improved First Chart Render PerformanceThe JavaScript library files needed on the server to render charts are now reduced making the initial JS chart load faster. |
|
Element.SecondaryColor Support in JS ChartsSecondary color is now applied in JS charts for use with finance candlestick and bar series and circular bar (activity ring) charts. |
|
Label.Outline Support in JS ChartsThe native label outline capabilities of .netCHARTING are now supported in client side charts as well. |
|
Three Highlighting Modes in JS ChartsElement and series highlighting is automatically enabled when hovering legend entries and element axis ticks. It is also available when hovering data elements, which is automatically enabled with the Venn chart type.- HighlightElement - Mutes all data except the hovered element. - HighlightSeries - Mutes all data except the element of the series being hovered. - HighlightElementGroup - Mutes all data except the element group being hovered. An element group refers to elements across all series that share the same x value or name. |
|
Specify Hover ActionsYou can specify the hover action of data elements, legend entries, and element axis ticks. |
|
Native Series FirstElement and LastElement properties for JS Chartshe native .netCHARTING series now support FirstElement and LastElement properties to specify the settings for the first and last elements. This is useful when applying settings to the chart default series, configuring those elements to show labels or assigning axis ticks to them. |

|
Element.XAxisTick And YAxisTick Support in JS ChartsThe x and y axis tick properties of element objects are now fully supported in JS Charts. |

|
Native Axis.Crosshair Property and Support for JS ChartsThe axis crosshair in JS charts can now be set through the .netCHARTING Axis.Crosshair property. |
|
Improved JS Chart Tooltip PositioningTooltips are now smarter and more aware of elements around them in JS charts. This makes charts easier to read when hovering chart elements with the mouse cursor. |
Improved JS Chart Interactions PerformanceGeneral chart wide performance improvements in JS Charts. |
|
Native Element.FocusGlow Property for JS ChartsThis property defines the outline of elements when they are hovered in JS charts. With combined tooltips, this outlines all elements mentioned in the tooltip. |
|
New in version 10.0
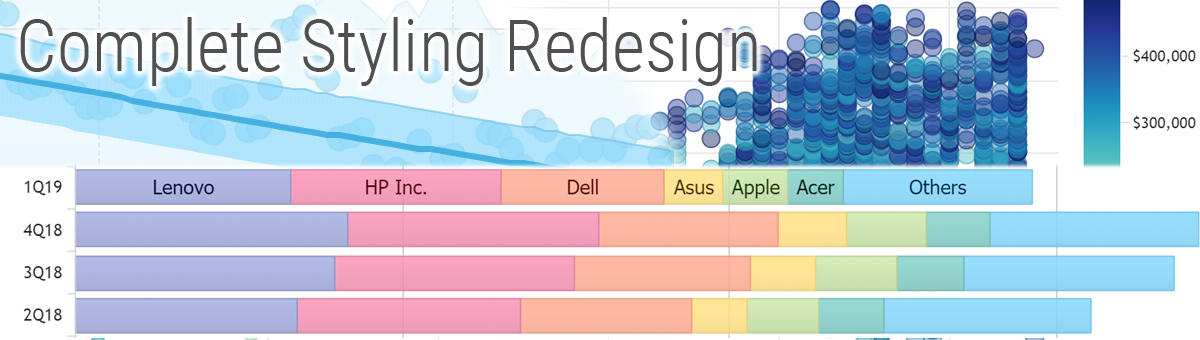 Image and JavaScript charts have a new modern visual style, across all chart types, with no special settings required. Legacy chart visuals can also be maintained with a single LegacyMode property setting applied for a given chart or an entire application making it simple to roll out style enhancements exactly as you require.


|
|

|
Spline tension controlThe spline tension option has been added to JavaScript charts. |
|
Axis Tick Label Auto-WrappingJavaScript charts will automatically wrap Y axis tick labels when they are too long. They will also wrap on the X axis if possible before angling. |
|
First and Last Point SettingsJavaScript chart setting Series.firstPoint and Series.lastPoint can be used to specify options only for those points. |
|
Superimpose Visuals with <absolute>JavaScript Microcharts can now be wrapped inside an <absolute> tag which allows overlapping several visuals such as sparklines. This provides a more in-depth expression of data inside charts such as calendars. |
|
Improved Auto Tooltip TextThe JavaScript chart automatic tooltips have been improved to automatically provide more useful and relevant information depending on the chart type and data that is shown. |
New in version 9.3
|
Gantt DependenciesThe advanced Gantt chart capability of .netCHARTING is now even more powerful. Project task dependencies for critical path analysis can now be visualized on Gantt charts. Starting tasks can be set to depend on the completion of another task or a number of other tasks as a group. |
|
Axis Range Ticks'Range ticks' may sounds contradictory at first, but are a powerful new addition for axis labeling. Axis ticks traditionally refer to a specific point on an axis scale; however, now have gained the ability to define a range. |
|
AxisTick CalendarPattern ValuesCombining CalendarPatterns with axis range ticks provides a new and compelling way to visualize time scales. Enabling range ticks to be automatically drawn for every month, quarter, year (or any other interval) is as simple as adding one line of code! |
|
Category Scale Names == RangesA new concept for category scales. String category names no longer refer to a single point on an axis, but rather a range. AxisTicks and AxisMarkers now accept either category name values or two category names that refer to a range that encompasses both categories. |
|
Logarithmic Scale ImprovementsLogarithmic scales now support zero and negative values. In addition, exponent format string 't' support is now available to shorten the large numeric axis values that often appear in logarithmic scales. |

|
Point Axis TicksThis feature automates complex coding tasks through a very simple API. A xAxisTick or yAxisTick property can be set directly on any data point (or the default) configuration object which adds an axis tick bound to point itself. |
|
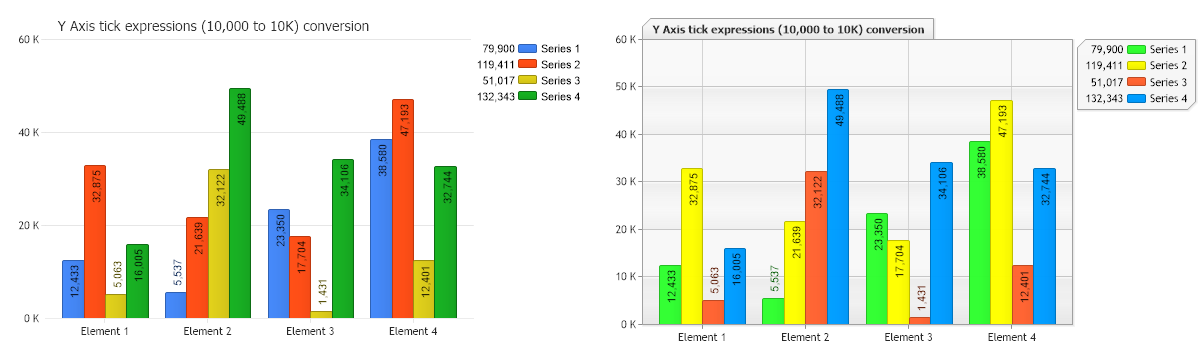
Axis Number Shortening and Magnitude FormattingLarge numeric values, which take time to read accurately, waste a lot of screen real estate.. Now, the axis can automatically shorten these values so that 56,000 turns into 56 k, 1,000,000 becomes 1M and so on. |
|
Datagrid ControlA powerful and tightly integrated data grid that binds to charts and also acts as a stand-alone grid connected directly to your data. |
|
Microchart and Icon SyntaxThe simple syntax that allows microcharts to be added to any label on a chart is also supported in datagrid cells. In addition, icon syntax provides access to the full library of icons for seamless usage in datagrid cells. |
|
Token Formatting and ExpressionsThe same formatting and expressions syntax supported within chart labels can now be used to define data grid column values. |
|
Chart to DatagridAn existing chart can show an alternative data grid of the charted data by simply setting the datagrid_enabled config option to true. A chart can also populate any div on the page with its data using the chart.toGrid('divId') function. |

|
Export to CSVWhen the datagrid CSV export option is enabled, a convenient button is generated that will save the data as a CSV file on the client's computer. |
|
AccessibilityWhen accessibility is a company-wide requirement, JSCharting offers an uncompromising solution. Whether your organization must comply with section 508 or WCAG 2.0, you now have access to all the options to enable and control your chart accessibility experience. |
|
Line CapsLine caps add deeper meaning and context to ordinary lines by communicating line direction, colors and symbols. Line Caps are automatically set to enhance visualizations such as Gantt dependencies and range ticks and can also be set for other lines on the chart (even on line series). |
|
Superscript and SubscriptSuperscript and subscript text is useful for many advanced labeling needs and avoids having math equations or numeric values written as 10^5. Both superscript and subscript html tags can now be used with any labels in JSCharting and will correctly render as SVG text. |
|
Updated Microchart Styling and OptionsMicrocharts have been enhanced with a clean and modern look.. Additionally, a rotate option has been introduced which is useful for custom fit and rotation requirements as well as rendering microcharts stacked horizontally or vertically across axis ticks. |
New in version 9.2

|
Microchart Visualizations.netCHARTING js labels are incredibly powerful supporting features such as microcharts and the ability to utilize the full icons library. The built in SVG icons library can also be used, enhancing visual clarity and creating more aesthetically pleasing experiences. |
|
Mosaic Plot/Variwide/Mekko chart typeVariwide, marimekko, and mosaic are all names associated with this powerful new chart type added in version 9.2. The variwide chart type works with category x axis scales and column series. Combining this type with y axis full stacked mode results in a Marimekko diagram, also known as mosaic plot. |
|
Interactive UiItem typesNew slider, file and dropdown scroll support user interface controls have been added in .netCHARTING 9.2. Sliders can be used to enhance chart interactivity by adjusting data scope visualization in real-time and include both single and dual handle configuration options. |
|
CrosshairsThis set of features provides greatly enhances analytic chart interactivity. Combined tooltips can be enabled and customized with calculations and microcharts to display quantitative relationships of groups of points that share x values, while crosshairs provide additional contextual detail displayed directly on the axes themselves. |
|
Axis scale break enhancementsScale breaks can now be defined with calendar patterns. Some source data, such as finance stock prices, may exclude weekends when markets are closed. It is now easier than ever to simply exclude weekends from the timeline x axis using scale breaks with weekend calendar patterns. Additional scale break styling options were added in version 9.2, including break width which can be specified with a seamless mode that does not mark the scale breaks at all. |
|
Data Point OptionsPoint focus glow styling options have been added which work in conjunction with combined tooltips to highlight relevant data points. In addition, a point '%icon' token can now be used in any point label or tooltip to aid in describing and identifying points. This is useful when multiple points are described in a combined tooltip. |
New in version 9.1
|
Calendar HeatmapA brand new chart type for 9.1, our intelligent calendar charts support automatic ranged views, tooltips and date grouping. Now you can add custom date specific data, merge multiple values or bind an event to a date range with ease. |
|
Heatmap Calendar HighlightsEasily highlight dates or date ranged with custom visuals for showing calendar availability, blackout periods, special events and much more. |
|
Calendar Views18 calendar views that break down time spans from decades to minutes. |

|
Label html tag improvementsNew label html tag support including <hr> and <img> and List support <ul> <li> |

|
Vector Icon support through the <icon> text tagThe icon tag can now be added to any text label with the full library of icons available including custom svg path support. |

|
Box layout system.netCHARTING version 9.1 introduces a major enhancement to the box layout and positioning system, unifying the legend, annotations, and uiItems into a single layout mechanism with positioning options that arrange the boxes either inside or outside chart area. |
|
Client side SmartLabelsVersion 9.1 includes an intelligent point labeling system that is capable of handling label collisions and fit issues automatically without obscuring other points and labels. |
CSV loading client sideThe window.fetch() function can be referenced through JSC.fetch() and is also supported in IE11 through a polyfill. The JSC.parseCsv(text) function splits CSV text into rows and columns, detects and separates header rows, and parses values into string or numeric values automatically. |
|
New in version 9.0
|
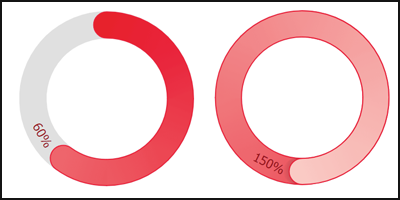
Circular Bar GaugesA powerful chart type for project timeline and task management, the Gantt type is now fully implemented with a modern client side and resolution independent approach. |
|
Circular Overflow IndicationOverflow indication uses a color hue shift that makes the number of times a circular bar overlaps easy to see at a glance. |
|
Linear GaugesLinear gauges are now supported in JS charts and are a welcome addition to many dashboards. Rounded caps or flat bars can be used to enhance styling flexibility. |

|
Hatch StylingHatch patterns can now be applied to JS charts to further strengthen accessibility support (for example aiding color blind users). |
|
Column Complete VisualizationThe traditional complete value visualization through a hatch pattern is now available in JS vector charts. This feature is ideal for differentiating elements for black and white display or for those who are color blind. |
|
Organizational Chart TypeOrganizational charts are now available using native vector JavaScript chart output and also include interactive panning for larger organizational data sets. |
|
Heatmap Chart TypeA new heatmap chart type is now available and is a perfect match with the enhanced SmartPalette support in .netCHARTING’s seamlessly integrated client side charts. |

|
TreeMap Cushion ShadingA specialized smart shading effect has been added to the JavaScript charts that help visualize the hierarchy of nested TreeMap data. |

|
Custom Legend EntriesThe advanced .netCHARTING legend feature set is now supported in JavaScript chart output. Custom legend entries can be used to summarize data or populate a legend manually with custom information. |
|
Legend TemplateLegend templates allow you to define legend columns enabling an attractive data-grid inside the chart image. This feature has now been enabled in JS charts and is ideally suited to single file chart / grid export and printing. |
|
Legend AxisMarker EntriesAxisMarkers now add an entry in the legend to clarify the marker meaning and exact value. |
|
Markers for all Series TypesAll chart types now support the addition of a marker visual to highlight a specific data point. |

|
Icon BrowserThe chart based icon browser provides a streamlined experience for searching and browsing the hundreds of icons available for use within .netCHARTING. |
|
Icon Support in any LabelIcons can now be used in all text labels in the JS chart. |

|
Multiple Shape LabelsMultiple labels can be added to gauge charts to decorate and provide additional contextual information. .netCHARTING will automatically position labels to avoid overlaps. |
|
SmartPalette Legend SupportSmartPalettes are now fully supported in JS charts including legend entries for specific smartColor entries. |

|
Axis Line BreaksNew support has been added for this visual enhancement for axis lines which breaks up the line at tick positions. This feature is now supported on linear and circular axes. |
|
Box Corner StylingBox corner styling is now fully supported in JS charts. |
New in version 8.4
 |
Gantt Chart TypeA powerful chart type for project timeline and task management, the Gantt type is now fully implemented with a modern client side and resolution independent approach. |
 |
Dynamic Token Tick & Axis Marker ValuesTick and axis markers can now be seamlessly updated without coding, based on tokens and calculations. This enables the addition of averages and other useful data derived values to display as a dynamic tick mark or axis marker with ease. |
 |
Custom TicksIn addition to the advanced label and tick generation system already in place, .netCHARTING now offers the flexibility of custom ticks to communicate axis specific information more effectively. |
 |
Logarithmic ScaleNew log scale support enables plotting exponential trends and statistical data. |
Time Y Axis Scale supportA time scale is an advanced scale which enables automatically display of a large variety of time and data hierarchies with automatically selected formatting. This advanced axis scale is now supported for both X and Y axis facilitating seamless Gantt layouts over time. |
|
Stacked Logarithmic ScaleLogarithmic scale support is now integrated for stacked charts, such as stacked bars and other related types. |
|
New in version 8.3
 |
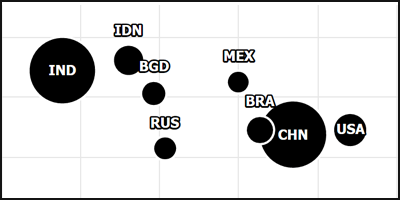
Massive set of highly tuned maps doesn’t require any 3rd party map files or mapping experience.netCHARTING now includes an extensive set of optimized vector based maps which can be displayed with a simple property setting. Maps are included for all countries, states and provinces in the world! |
 |
Map context shows surrounding maps automaticallyWhen mapping a specific region, the surrounding geographic areas can be included to provide context and avoid the floating country effect. Best of all, subtle styling is automatically applied to such context areas, so they provide context without visual complexity. |
 |
Custom map files using geoJSON and topoJSON (optional)While the comprenshive set of state, province and country maps will cover most client's complete mapping needs, for advanced users geoJSON and topoJSON files are supported so you can utilize your own files for custom mapping. |
 |
Add map layers in real-time for advanced dynamic mapsSince .netCHARTING includes a highly optimized map set the different maps seamlessly link together. This allows for unique dynamic mapping cases where higher detailed areas can be dynamically loaded on top of an existing map, loading and aligning perfectly without user intervention. |
 |
Plot lines, markers, and bubbles on maps..netCHARTING’s new vector map charts support various series including lines, markers and bubbles to meet your most in depth mapping requirements. |
New in version 8.2
 |
Dynamic Smart ScaleBreaksScaleBreaks enable showing large variations of data while still maintaining legibility for lesser values. .netCHARTING support multiple scale breaks dynamically with seamless transition animations when data points are added that necessitate a break. |
 |
Treemap Chart TypeTo complement heapmap charts, a powerful new treemap chart has been added for proportionally visualizing hierarchical data. |
 |
Funnel, Pyramid and Cone Chart TypesNew funnel, pyramid and cone charts are now supported across different render engines, including resolution independence and interactive tooltip support. Animation support enables seamless transition for both legend series or element enable / disable and initial renderings. |
 |
High Resolution DashboardsStunning HiDPI dashboards may be created in .netCHARTING 8.2 using SVG backgrounds combined with dynamic resolution independent charts. A number of unique examples are included showing this effect. If you have a specific dashboard need, please contact us. |
New in version 8.1
 |
Range Column and AreasNow bar, column and area charts support points with start and end values in JSC. This enables a column or area that starts at a value greater than zero, for example, and allows for effective and attractive display of ranged data. |
 |
Error barsComplete support for error bars and values has been added to JSC along with support to automatically populate element error properties from your own database. As part of a comprehensive system for representing errors in collected data, .netCHARTING leverages multiple sub values support in JSC with rendering as error bars, lines and markers. |
 |
Circular Gauge TypeA stunning new gauge / dial chart type has been brought to JSC. In addition to supporting a single chart, multiple gauges can be added for instant executive dashboard implementations. Many advanced features are supported with this new type including quarter, half or arbitrary sized gauges. |
 |
Pie Slice LengthNow individual pie slice lengths can be varied based on a separate data independent of the slice total enabling multidimensional data display. |
 |
Pie Starting AngleNow it is simple to set the starting angle for any pie chart to a specific value required to match your aesthetic requirements. |
 |
Radar ChartsRadar and Multi-Radar have been added to JSC. Great attention was paid to maintaining visuals across these unique charting types including unique radar optimized shading types. |
 |
Label ExpressionsNow you can perform common expressions directly within labels in JSC using values from template tokens. For example 100-%YValue to show a label calculated as 100 minus the total for that elements Y value. |
New in version 8.0
 |
New Javascript Chart EngineComplementing the Silverlight Navigator first introduced in version 6.0, a powerful new JavaScript and HTML5 charting system has been added in .netCHARTING 8.0. This engine expands on the previous resolution and browser independent support while adding more chart types and customization options all without needing to write a single line of JavaScript code! |
 |
JavaScript NavigatorA complete multi-pane pan and zoom interface has been added to the latest version. The JavaScript Navigator supports advanced finance charts and real-time zooming with high performance on all devices. |
 |
Finance series typesNew finance series types including candlestick and OHLC have been added in .netCHARTING version 8.0. |
 |
Multiple chart areas (Navigator)Multiple chart areas are now supported with the JS Navigator. Stepping beyond simple volume and pricing, this support enables advanced calculations across many chart areas all synchronized with a common x axis. |
 |
JSC Label Token SupportNative label token support has been added to the JavaScript charting layer. With label tokens, you can customize the enhanced tooltip functionality quickly and easily to show data from elements and custom fields with no special coding or database handling requirements. |
JSC Label callbacksFor even more advanced label customization and actions, label callback functions are now also supported in JavaScript charts. |
|
Client side formatting and data calculationsClient-side .NET style string formatting support has been added which is a helpful feature for use in label callbacks or other client-side usage cases. |
|
 |
Custom AttributesCustom attributes are a powerful system for linking your own data from a database to the .netCHARTING object model. Now custom attributes can also be used in the JSCharting component. |
 |
Smart Default TooltipsDepending on the data and chart type, the interactive tooltip displays relevant and useful calculations automatically tuned based on the usage case. If the automatic values don't meet your specific needs, you can also customize with your own tooltip template configuration. |
 |
Major and minor tick supportAlong with major axis ticks, minor axis ticks are now supported in JSC as well. |
Access to full JSC json APIThe Chart.JS.Settings property now enables you to specify any settings for client-side chart configuration directly by path. |
|
New in version 7.0
 |
JavaScript / HTML Chart OutputComplementing the Silverlight Navigator first introduced in version 6.0, a powerful new JavaScript and HTML charting functionality has been added in .netCHARTING 7.0. As always, the complete client side functionality is available through our server side model with no client side development experience required. Setting a single property will enable JavaScript Charting or Silverlight Charting. |
 |
.netCHARTING v7.0 New VisualsGet a fresh new look for your old charts without a single line of code! Automatically improve the look and balance of your legacy charts simply by using the latest version of dotnetcharting.dll. If you are attached to your legacy look--you can easily maintain it with a simple web.config entry and enable the new look on a chart by chart basis instead. |
 |
iPhone, iOS, Andoid, WP7 & Tablet supportOur interactive JavaScript charts are just as beautiful and functional on an iPad, iPhone, iPod Touch, Android Phone, Android Tablet, Windows Phone, Mac, PC and more. .netCHARTING version 7 provides the widest support across devices, with a fast-to-load, plugin-free implementation--the goal with JavaScript Charting is to work seamlessly on any device, anywhere. |
 |
Touch-screen supportWorking with a phone or tablet? Now you can interact with touch event support to get tooltip data, zoom or scroll through charts. |
 |
Browser CompatibilityOur JavaScript Charting is built with a focus on extensive browser support including Chrome, FireFox, Safari, Opera, Internet Explorer (even as far back as version 6) plus mobile and webkit browsers used on the majority of phones and tablets. Advanced interactive and client side charts are now available to the widest audience using .netCHARTING. |
 |
Dynamic TooltipsAdvanced tooltips with custom attributes and dynamic coloring provide quick and easy identification of elements with additional useful information such as element value and more through a token based system. Color highlights, seamlessly integrated into the tooltip box, help effortlessly clarify which element is being viewed when working with data dense charts. |
 |
Bar Shading EffectsVisual fidelity is maintained between server side and client side charts with client optimized bar shading including animation support. |
Comparable Visual and User ExperiencesClient side interactive charts typically sacrifice a lot, providing a substantially different visual and functional experience vs server side charts. With .netCHARTING 7.0 you get, for the first time, a level of polish and visual quality that is comparable to server side offerings across the same chart types, while still leveraging animation, touch and mobile specific features. |
|
AnimationClear and refined animation is built in to JS Charting including axis animations, bar and pie drawing, line growth, real-time drawing operations and more. |
|
Real-Time updatesChart values can be added in real-time and immediately display in the chart area, even dynamically scaling the axis as needed. |
|
Client Side interactivityA number of interactivity features are supported including advanced dynamic tooltips, touch interaction, zooming, series interaction and a powerful API for advanced customization. |
|
 |
Image, vector and PDF ExportClient side charts may be saved or exported in a number of formats including JPG or PNG images and native vector PDF files (compatible with Adobe and other PDF tools) in addition to SVG files. |
 |
Client side printing supportFull support for client side printing is seamlessly integrated. Click the optionally enabled and customizable print button and you get a true hard-copy representation of the chart being viewed. |
 |
Series HidingDynamically hide series and rescale axis to the remaining values without that series enabled, using a simple click on the series entry in the legend. A second click enables the series again with an animated addition. |
 |
Element HighlightingHighlight elements on mouse over for easy identification and visual connection to element specific tooltips. |
 |
ZoomingClick and drag to zoom into regions of a given chart to view them in more detail. Return to the original zoom bounds with a single click or tap. |
Client-Side JavaScript APIA application programmer's interface enables advanced developers to further customize and interact with the JavaScript charts, however all features are accessible through our easy to use server side model as well. No experience with JavaScript is required to fully leverage .netCHARTING V7.0's powerful JavaScript charts just as no experience is required to leverage the compelling .netCHARTING Navigator for Silverlight. |
|
 |
Multiple-Axes SupportAs with .netCHARTING, multiple axis support is standard and seamlessly integrated. |
 |
New Default PaletteAs part of the new look, a new default palette has been added to complement the new visuals. |
 |
New subtle Shading EffectSubtle shading with a focus on color constancy and crisp visuals has been added and utilized in the new look in .netCHARTING V7.0. |
 |
Dynamic Default ShadingA dynamic visualization system has been added to implement shading throughout the chart to enhance the look and feel while maintaining balance between design elements in the chart. |
 |
Multi-Color Gradient stopsGradients can now support multiple colors and stops to create advanced shading such as the chart area grid fills seen in the new look. This can also be used for any chart objects which support backgrounds such as the chart area. |
 |
Shadow Expansion SupportA new feature for shadow support enables shadows to size larger than the object that throws the shadow for a unique soft or hard edged border effect. |
New in version 6.2
Released 2/9/2011
 Surface Chart Type
A major new chart type has been added supporting both 2D and 3D surfaces in a new 3D perspective view chart area.
 Box Header Ribbon caps
A new visual style for end caps allows you to create highly tuned ribbon visuals to match the latest innovations in web design and seamlessly integrate with your site.
 Surface Combination Types
The new surface type supports subtypes which can be combined including 2D and 3D combinations where the 2D view is rendered on the base of the 3D chart area and acts as a projection.
 Mapping Range SmartColor Support
.netCHARTING maps can now utilize the new range smart color functionality enabling the displayed color value to be set from the specified value and a gradient of range smart Colors.
 Box Header Orientation
Headers may now be placed on the top, sides or bottom of a box providing unprecedented visual flexibility for box design.
 Web based Surface Designer
[
Demo ]To help you explore the rich functionality of the new surface chart types, a web based designer has been added. This enables you to play with the various surface options, then copy and paste the generated code to use in your own project or web page.
 X/Y Surface Types
In addition to the traditional surface mesh or solid fill, .netCHARTING supports X and Y surface charts which render only the X or Y component of the surface creating a unique and innovative visual effect.
 Contour Charts
Also supported in combination with other surface types, the contour type can be added in 2D and 3D variations. The number, or density, of contours can be customized through the ContourCount property.
 Floating and Anchored Surface Support
The traditional floating surface chart terminates at the Z value of the points on the edge of the surface. To enhance edge clarity for certain charts, the DropToFloor attribute can be utilized. This drops the surface edge to the minimum value in the surface chart rendering a clear vertical face on the edge.
 Surface 3D orthographic projection
You can control the tilt and rotation of the 3D view to display the surface chart in the most effective way possible to communicate your data.
 Surface dynamic color support
The .netCHARTING surface system supports automated SmartPalette™ generation from color inputs.
 Interpolated Surface Fill
Surface color fills may be mapped 1:1 to their underlying data or interpolation can be utilized to automatically smooth the surface colorings with a configurable setting.
 Surface transparent value support
Partial or open surfaces are possible with transparent element support.
AJAX Zoomer Enhancements
We have continued to improve the AJAX zoomer system with enhanced performance and handling combined with the ability to coexist with the most popular AJAX libraries and usage cases.
 Line Transparency support
Now you can customize the line transparency within charts. This is particularly useful in surface charts where lines can be removed, form the chart itself, display as solid colors or custom dynamic colors based on the surface values.
 Surface 3D lighting
To enhance realism, surface lighting can be enabled to subtly shade the surface and give dimension to surfaces with a more monochromatic palette.
 Z Axis support
A new Z Axis has been added for surface charts and may be customized along with the X and Y axis.
Enhanced box header designer
The box header designer has been enhanced to support the new ribbon and orientation options.
Range SmartColor Transparency
Smart colors now support transparent and partially transparent colors within their range.
 Convert any series into surface data
New methods have been added to easily convert multiple category series or a DateTime series with date grouping options into surface data, which can then be directly consumed to render surface charts.
Surface Coloring
Surface series lines and fills can be controlled independently with dynamic, solid, and transparent color settings.
Version 6.1
Released 11/24/2010
 TreeMap
Chart support
TreeMap
Chart support
[
Example ]A powerful new charting type for treemap and heatmaps has been added.
 Swatch
Support
Swatch
Support
[
Example ]To enhance and support the TreeMap type, a new swatch legend system has been added supporting ranged values and flexible visualization and layout support, in images and even within HTML.
 Box
Header Customization
Box
Header Customization
An advanced new box header
system has been added supporting 10,000+ unique combinations
with the advanced alignment and endcap visuals, shadows,
offsets and much more.
Navigator Enhancements
The .netCHARTING Navigator first introduced in 6.0 has continued to be enhanced including support for chart area hotspots and chart area position tokens.
 Box
Header Layout Options
Box
Header Layout Options
[
Full Sample ]Advanced alignment options provide complete flexibility in combination with endcaps to achieve the specific polished header implementation you envision.
 Box
Header Designer
Box
Header Designer
[
Try It ]To help familiarize yourself with the advanced box header support and rapidly prototype header visuals, a new web based box designer has been included in .netCHARTING 6.1. Now you can design boxes and copy / paste the required code to create that header design into your code in seconds.
 TreeMap
Shading Support
TreeMap
Shading Support
Advanced shading options are
available for all treemap charts for enhanced visuals
including both the standard shading types and background
optimized shading. Shading adds visual polish while
maintaining legibility.Color Range Support
Smart Palette additions have been made for GetValueColor and GetScaleRange to support the advanced features and functionality of the TreeMap type and swatch legend display.
 Box
Header Cap Styles
Box
Header Cap Styles
More than ten unique end cap
styles can be applied independently to the start and end of a
header for unique visual customizations including pointers,
tabs, ribbons and much more.
 Navigator
Marker Support
Navigator
Marker Support
Complete axis marker support
including axis marker labels are now available.Navigator Drag and Throw
A unique UI innovation which mimics advanced touch interfaces, drag and throw utilizes acceleration to enable more intuitive and rapid nagivation when using the click and drag interface.
 Navigator
Interactivity
Navigator
Interactivity
With the addition of element value
at x position, the navigator can return interactive results of
click tests within the chart area and display the results in
your page.
 Navigator
Loading Enhancements
Navigator
Loading Enhancements
Four new animation styles are
available for display while the navigator is loading.
 Navigator
String Customization
Navigator
String Customization
The loading strings for the
navigator can now be customized to control the message text or
modify the string values for internationalization support.
 Navigator
Preview image enhancements
Navigator
Preview image enhancements
You can now control if
the preview image is displayed or not with a simple property
setting. In addition, the preview image has been tuned to more
closely match the interactive navigator after it loads.Navigator Windowless Mode Support
Based on client feedback, you can now support windowless mode to better interact with your own client side elements on the page.Winforms 6.1 Updated
Now updated for 6.1, the Winforms release is once again in feature sync with the WebForms release including the new treemap charting types, complete header and swatch support.Version 6.0
Released 7/6/2010
 Silverlight Navigator
[
Demo ] [
Usage Video ]A powerful new charting product has been seamlessly integrated into .netCHARTING. Now developers can provide advanced interactive Silverlight charts with a simple property setting and no Silverlight specific coding required. This high end visualization solution is included at no additional charge with every .netCHARTING license sold.
Highly optimized user interface
The .netCHARTING navigator has undergone substantial usability testing to help tune the minutia of design to ensure it is as powerful and intuitive as possible. In side by side testing with both Yahoo and Google Finance, the navigator proved to not only have stronger performance but also be much easier to use to accomplish common tasks. The end result was a 2-3x improvement in time to accomplish specific viewing and selection tasks while using the .netCHARTING Navigator!
Navigator Selection AidsAdvanced selection aids provide visual feedback to help clients locate and select data of interest while maintaining continuity in real-time. Values display at the pointer position, while selecting ranges, on hover and for the range displayed in the chart area. |
||||
|
 Real-time Navigator AutoTrack™ Support
The navigator supports chart linking to auto track data and trends based on
mouse hover. As the user hovers over a preview chart, the navigator
seamlessly moves to the applicable data in real-time within the dynamic
chart.
Advanced Arbitrary Selection SupportSelections may be made directly on the chart and preview areas with advanced indicator support for start and stop positions of the selection range in real-time. |
||||
|


Mixed Selection
When both cell and arbitrary selection are enabled, they can be used at the same time. For example you can start by selecting a cell and end the selection at an arbitrary position and vice versa.
Cell Selection SupportIn addition to arbitrary selection, selection can be made with cells, snapping to significant regions such as months, days or hours with a single click. This support also enables rapid drill-into support by clicking cells to progress to more detailed views of the data. |
||||
|

 Click and Drag Support
Navigate the chart easily with multiple paths including click and drag
(hand) support in addition to traditional scroll bar movements.
Advanced zooming optionsZoom into data using the scroll wheel, scroll bar handle resizing, scroll bar click-hold-resize, cell selection, arbitrary chart area selection and much more. Parallel paths enable users to use the most intuitive options for zooming that fits their expectations while other options remain in the background available, yet not complicating their experience or the user interface. |
|||||||
|
Smart Handle Support
Scroll bar handles are intelligent and remember past positions. Double click actions on the handles (left or right) enable maximize and return to last position, while double clicking the scroll bar itself supports maximize and return to last size and position for both handles at once. Innovative DeepZoom Support
Unlike most implementations which cease to allow selection as you zoom due to
scroll bar selection, the .netCHARTING navigator automatically rescales the
selection preview area as needed to maintain an usable scroll bar at all
times. The system even automatically scales out of deep zoom operations as
scroll bar size is increased or the selected area increased.
 Navigation Bar
A powerful navigation bar gives a centralized location for many
interactivity operations including history (undo/redo), date / range
selection and quick zoom buttons. Developers can quickly and easily
customize the navigation bar options as well as the interactivity features
exposed to the end user which are independent of the navigation bar.
 Advanced Date and Range selector
Usability testing revealed a major weakness of most interactive charting
systems was the range selector. .netCHARTING solved this problem with a
ground up re-write of the range selector which works for multiple types of
data and is not limited to date selection. This interface has proven to
allow faster range selection in side by side tests with traditional date
inputs while also maintaining continuity with real-time updates as the range
is being selected. Furthermore, the selection is not limited to dates which
is very useful for alternate axis support. History
A history system tracks user operations as they occur and supports undo and
redo within the collected history by clicking on the arrow buttons in the
navigation bar.
Quick Zoom Buttons
Developer customizable for arbitrary ranges and custom labels, quick zoom buttons enable a fixed zoom range to be displayed with one click. For example, the viewer may jump to a range for one month or one day.Navigator Performance
The new Silverlight charting product automatically utilizes multi-core systems for enhanced performance, while it also has been tested and performs well on legacy systems. The .netCHARTING Silverlight Navigator is capable of processing, animating and scaling tens of thousands of elements in real-time.
 Dynamic Help
The .netCHARTING Navigator dynamic help system automatically populates any
HTML element with real-time context sensitive help when users hover over the
dynamic chart. This system enables formatting and display options for help
tips integrated at the page level.Animation Support
Transitions are seamlessly animated to aid user experience continuity and provide natural transitions. Example animations include transitions (movements) between areas within a chart, zooming, deep zooming and rescaling. Slideshow and Presentation Support
The advanced animation model supports unique slideshow and presentation
functionality which enable you to navigate through data to points of
interest and provide text notes and descriptions. Users could also do self
guided presentations by clicking on points of interest from a list and
having such points navigated to automatically.
Silverlight Interactivity with a single setting
Old and new .netCHARTING users can leverage the advanced interactivity with a single property setting. Turn on the navigator and .netCHARTING goes to work in the background seamlessly generating, loading, and displaying the Navigator based on the same server side properties used for a legacy static chart usage case.Automatic Plug-in detection and down-level support
Seamlessly display a static chart image if the Silverlight Plug-in is not yet installed, display the static chart and prompt to install the plug-in or automatically prompt to install the plug-in. .netCHARTING is optimized to provide the best user experience regardless of their configuration.
JavaScript APIAdvanced developers can control chart movements through an
intuitive JavaScript API while no such experience is required to get the
most from the .netCHARTING navigator, it is available for those that require
it. |
||||
|
 Legendbox Position Flexibility
A new automated legend box position is supported within the chart
area.
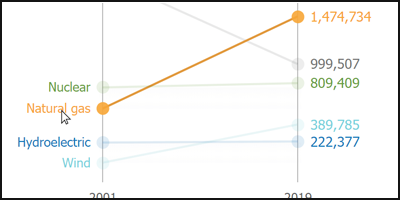
 Percentage Change Calculation Support
A new token is supported at the series level which provides the
percentage change between the first and last element of the series visible
on the chart areaVersion 5.3
Released
4/15/2009
Rich ToolTip Support
Complex tooltips are now supported with inline formatted image text, MicroCharts, InfoGrids and even full chart previews ideal for drilldown cases.
 Annotation
Size Customization
Annotation
Size Customization
It is now possible to set annotation
size directly as well as dynamically size contents in width or
height while the other dimension is automatically sized based on
the contents.
 Pie
Annotation Orientation
Pie
Annotation Orientation
The pie chart type presents a unique
visual challenge for annotations. A specifically tuned orientation
enables annotations to ring the outside of the pie, preventing the
pie itself from being obstructed.
 AJAX Zoomer Category Support
Now you can zoom, pan
and scroll category axis charts (such as names or text) in
addition to numeric or date axis. You can also specify the zoom
starting position and control the axis ticks which determines
scale. Large charts have never been simpler to display regardless
of if they are employee results by name, product sales by product
or any other possibilities.
 MicroChart Data Feature Additions
Significant
additions have been made to make creating and populating
MicroCharts effortless. New functionality includes sub value date
grouping, simplified subvalue creation and enhanced calculation
methods for sub values.
 Organizational
Chart Zooming
Organizational
Chart Zooming
Advanced pan and scroll support has been
added for organizational charts. Now you can easily view an org
chart of any size and click to expand or contract nodes within the
org hierarchy. As always, organizational charts support simple
binding to your database data and advanced annotation formatting
and shading to ensure your charts look exceptional.
 Organization
Chart Drill Down
Organization
Chart Drill Down
A .netCHARTING first, org charts now
support drill down in addition to expansion. This gives a unique
view of charts contained to a single viewing pane with the ability
to drill down into or back out of the hiearchy while maintaining a
fixed view without scrolling. Level support further complements
this feature by allowing more data to be displayed in one frame at
a given time.
 Organizational
Chart Indicators
Organizational
Chart Indicators
Unique visualizations are provided for
nodes to indicate if they support expansion or contraction. In
addition, you can easily customize the display with your own
images for actions such as node addition, removal, or expansion /
contraction operations.
 Dynamic
Organization Chart Creation
Dynamic
Organization Chart Creation
With .netCHARTING it is simple
to create a web based form for dynamic org chart creation. Simply
click on a org level to add a node below it or remove a given node
all from a easy to use web interface. A sample for dynamic org
chart creation is included with .netCHARTING.
 Organization
Chart Expansion
Organization
Chart Expansion
Expansion allows an organizational chart to
grow as nodes are expanded. Here too, there is flexibility for
display when using AJAX pan and scroll; the chart can maintain its
size or, within a fixed window, elements can be sized smaller on
expansion to fit within the specified window. .netCHARTING now provides one of the most advanced organization charting feature sets of any product. As always, these advanced add-ons are included with every .netCHARTING license with no additional cost.
 Object Chart Creation
Now you can easily create small
chart images from labels and annotations. These charts are
particularly well suited for usage in previews, tooltips and
dashboard implementations.
 Background
Shading
Background
Shading
The chart background box now supports shading in
addition to the chart area box. Two new shading effects
specifically designed for use in backgrounds have been added in
this release.
 Mapping
Interactivity Enhancements
Mapping
Interactivity Enhancements
.netCHARTING includes advanced mapping functionality with every license purchase; no add-on required! The latest version now supports rich tooltips on maps which can include images and text data along with hotspot interactivity.
 Map
Shape Annotations
Map
Shape Annotations
All map shapes now support annotations. Now it is simple to click and view detailed information for a given map location within an annotation. You can also tune the visuals of the generated annotations to specifically match your applications requirements.
 MicroChart
Feature Additions
MicroChart
Feature Additions
A new Image MicroChart including Image sizing and rotation allows for innovative use of MicroCharts as labels for chart
elements. The possibilities are endless and options can be
controlled programmatically based on your own database data.
 New
MicroChart Scale Option
New
MicroChart Scale Option
A new bottom scale gives additional
scale layout functionality for MicroCharts.
 MicroChart Interactivity
Interactivity support
has been added with the new tooltip and url support for
MicroCharts. Using Image MicroChart with URL setting allows for
creating clickable icons.
 Sample
Search
Sample
Search
The Asp.net sample browser now offers a search
option. An API member or keyword can be used to instantly find all
related samples and improve productivity.New Token Support
The powerful .netCHARTING token system has continued to be expanded with token support for ID and ParentID for organizational charts along with new calculation based additions for PercentOfSeriesMax, PercentOfMax and PercentOfGroupMax. Now you can inline these values simply be using the template token and the chart will render with the calculated value specific to the object used.New Visibility Options
Simply control the visibility of a given subvalue or line with the new Visible properties added for these objects.Version 5.2
Released 12/15/2008
 MicroChart chart type added
A major new chart type has been added which enables small charts,
ideal for display in grids and other tabular visualizations.
MicroCharts are also well suited for business dashboard
implementations.
 MicroChart Types
Many different visualizations are possible with MicroCharts
including bars, gauges, progress bars, bullets, sparklines, area
lines, scales, pies and markers.
 MicroChart Label Usage
In addition to stand alone usage, MicroCharts can be used inline
within any chart label. This allows unique usage such as
labeling a pie slice with a MicroChart of the values that make up
that slice or labeling bars with their subvalues.
 InfoGrid™ Support
A unique, new, image based grid is now available with
.netCHARTING. InfoGrids combine tabular data, line separators,
symbols and images using a simple, yet dynamic markup language.
 MicroCharts in InfoGrids™
InfoGrids(TM) can also serve as containers for microcharts,
providing a powerful mini dashboard implementation that can be
easily viewed as a single image or used as part of a larger
dashboard implementation.
 MicroChart DataGrid Usage
In addition to usage within InfoGrids(tm), MicroCharts can also
be used within traditional datagrid or gridview controls.
 InfoGrid™ Label Usage
Stand alone or in a label, InfoGrids provide exceptional
flexibility and seamless integration with any data
visualization.
 2D Line & Spline series line caps
Now series lines and splines can be terminated with an endcap
such as an arrow to show continuing trend or add visual polish.
 New Element Markers
The set of predefined element markers has been expanded with an
up arrow, down arrow and inverted triangle.
 Pie Start angle
Now it is simple to set the starting angle for any pie chart to
a specific value required to match your aesthetic requirements.
 Gantt Dependencies
Link tasks with ease using the new Gantt dependency
functionality. Dependency lines are automatically routed to
provide the best visual balance and avoid overlaps.
 Horizontal Rule Markup tag
The new horizontal rule enables you to visually separate data in
labels and InfoGrids™.
 Dashboard Samples
In addition to the many new feature samples, version 5.2 adds a
number of specific dashboard samples which illustrate how
multiple charts can be seamlessly integrated into a
sophisticated digital dashboard.Automated Drilldown Weeks to Days
Now you can enable automated drill downs from weeks to days in addition to months to days with a single property setting.
DataEngine SQL Parameter support
New support has been included so that you can add SQL statement parameters using the DataEngine's AddParmater method, the same as you would for a stored procedure.AJAX Zoomer HotSpot Support:
Hotspots are now supported within the AJAX zoom and scroll interface to launch specific URLs on elements. In addition, the complete .netCHARTING token system can be used to pass in values to your target page specific to the element being selected.
Version 5.1
Released 9/9/08
 Organizational Chart Type
A powerful new type has been added for visualizing organizations
and other hierarchical data.
 Organizational Vertical Layouts
Vertical linking provides enhanced layout and space savings for
organizational charts.
 Organizational Shading
The complete set of .netCHARTING shading types are supported
within organizational charts including box and header shading
support.
 Advanced Label Formatting
To complement the new organizational chart type, the label
system has been significantly enhanced and now provides layout
functionality with embedded image support and independent
sub-string formatting within a given label. In addition, this
new functionality may be leveraged in all chart types, not just
organizational charts.
 Block Formatting and features
Now it is simple to define a block within a label and control
the font type and style. Visual effects common to labels
including outlines, digital readout and more are also supported
using simple attributes.
 Block Alignment
Alignment control enables quick and easy alignment of labels and
values for example, using a common center line by right
justifying labels and left justifying values.
 Block URL and Tooltip Support
The addition of URL and tooltip supports enables inline links
within label text. Both URL and tooltips support multiple
definitions per label and support the dynamic token system for
data population.
 Label Image Streaming Support
In addition to path based image sources, .netCHARTING will also
automatically obtain images from remote stream sources such as
aspx pages. This enables simple consumption of other dynamic
charts or images within a given chart.
 AJAX Zooming for Mapping:
The AJAX zoom and scrolling functionality added in 5.0 is now
supported in mapping. In addition to client side scroll bars,
users can navigate maps with the familiar click-drag interface.
 Mapping line support
You can now add lines connecting points based on latitude and
longitude. Maps utilizing a projection will automatically curve
lines appropriately.Mapping Shape Coordinates
The new GetShapeBounds method returns a bounding box using real-world coordinates (latitude and longitude) for a given shape or part of a map. For example, the coordinate bounding box of a state or county.Background Transparency
Transparency can now be controlled for any background. Combined with PNG output, transparency can be seamlessly integrated with web page elements in the background.New Visible Settings
Now it is easy to disable backgrounds and shadows as required using the new Background.Visible and Shadow.Visible properties.
 Datagrid custom attribute support
Custom attributes are a powerful system for linking your own
data from a database to the .netCHARTING object model. It is
then simple to access these values using tokens. Now custom
attributes can also be used in the automatically created
datagrid with both single and multiple series sources.GridView support
In addition to custom attribute support, the automatically data population is now supported with the newer GridView control in addition to the DataGrid control.Access DB Support
Now the newer .accdb files are now automatically detected and supported as with the older .mdb files.
 New automated msi based installer
The new installer configures samples / permissions automatically
to get you up and running immediately without manual
configuration required. In addition, an unpack only option is
provided for remote or manual deployments, if preferred.
Version 5.0
Released 5/19/2008
 Ajax Scrolling implementation
.netCHARTING 5.0 adds an advanced AJAX scrolling implementation. Within an
user defined viewport, users may use scroll bars or scroll arrows to navigate a
larger chart view. Chart rendering occurs only as needed for the currently
viewed portion of the chart. In addition to using scroll bars, users can use the
familiar click / drag interface, common to mapping applications, to navigate.
.netCHARTING Ajax automatically synchronizes the scroll bar positioning when
utilizing click drag or scroll bars can be disabled if not required.
 Ajax Zooming implementation
In addition to scrolling and click drag navigation, advanced zooming
functionality is supported. Users may select from box or cross hair selections
for zooming, zoom on x and y concurrently, y only or x only and navigate the
zoomed view through scroll bars, click drag or both.
Ajax context menu
A right click context menu exposes powerful interactive options for zooming and scrolling including zooming specific axis, enabling zoom or drag, zooming in or out and showing the original zoom constraints.
 Ajax scrolling viewport positioning
The new scrolling functionality enables you to define data ranges for the viewport (e.g. 10 elements, a specific date range or numeric value range).
In addition, you can define the scroll starting position or range. Using these features together, you can display a large data set with a starting position at the specific information clients are most interested in while providing them easy access to surrounding values through simple scrolling or familiar click drag interfaces.
 Ajax ToolTip display:
When in a scrolled or zoomed view, tooltip functionality is still available
utilizing a transparent callback to obtain the regular element tooltip value and
display this clientside on hover for the current cursor position within the
chart.
Ajax Auto updating implementation
For scrolling, zooming or both, the underlying chart may now be automatically updated on a fixed interval. This update occurs in the background and the rendered sections in view are automatically updated without a page reload.
 New shading effects
Continuing our innovative shading effects, .netCHARTING 5.0 provides brushed
metal and chrome visualizations for a variety of chart types. Shading effects
provide the visual impact of 3D charts with the legibility of 2D charts.
 Pie Shading Effect additions
A new glow effect has been added for 2D pie charts. In addition, the new
brushed metal and chrome effects are also supported on 2D pies charts.
 Bubble Shading effect additions
In addition to the new brushed and chrome shading effects, a new bubble
specific visualization option has been added. All three are now supported for
both regular and stacked bubbles.
 Background Shading additions
The powerful background object in .netCHARTING enables easy customization of
annotations, boxes, title boxes and more. The new metal shading effects are now
supported for backgrounds.
 Thermometer shading additions
Brushed and metal shading are now supported in thermometer gauge charts.
 Shaped Bubble shading support
Bubble shapes enable pictorial representations and can scale in size when
used in bubble charts. Shading effects for brushed metal and chrome are now
supported for bubble shapes.
 Interpolated value calculations
Now it is simple to obtain the interpolated value for a given x or y value
with a single method call. This enables you to obtain the value between elements
for example if you had data points of sales for the first of every month you can
now plot or obtain the value for any day between those dates.
 Axis Range adjustments on a per series basis
Now a simple setting enables you to exclude a given series from .netCHARTING's
intelligent axis range calculation.
 Selective default element settings
This new feature enables you to apply element defaults conditionally based on
specific criteria. In such a case, only the elements matching the criteria you
specify will take on the defaults defined. These smart defaults may be applied
at the series or series collection levels to apply to any elements they contain.
Inverse Series Trim
Developers have come to depend on series trim as a quick and efficient way to cull data points from a given series. Now a new setting enables the inverse of series trim. For example, if you trimmed weekends for a specific chart and now wanted a similar chart including only weekends, you could accomplish this with a single line of code.
 Legend box absolute positioning and sizing
The already flexible legend box has been further enhanced with the ability to
utilize any size and position you wish. You may also set only the position and
have the size automatically determined based on the legend box contents.
 Pie chart absolute positioning and sizing
Now individual pies can be sized and positioned as you wish within the chart.
In addition to layout flexibility, this allows for unique pie within slice
charts and other custom compositions.
Radar chart absolute positioning and sizing
Individual radar charts can now be sized and positioned within the chart. In addition to layout flexibility this allows for unique combinations of large and small radar charts within the same chart.
 Label Image Support
Any chart label can now accept an arbitrary image in place of the label text. This feature opens a new world of labeling and visualization
possibilities for your charts.
 Smart label absolute positioning
Now you can override the automated label positioning and specify an absolute
position if required for your chart design.
 Smart Label padding
Labels may now be configured with padding settings which influence the
automated layout algorithms ensuring that padded areas do not overlap.
 Smart Label Distance
A new maximum distance threshold for smart labels enables .netCHARTING to
only render a smartlabel if it can cleanly fit cleanly within the distance
threshold defined.
Mapping Label Once Option
For maps it is common to have many small land masses (islands or separated areas) that may contain the same label (e.g. country name). This option ensure that a given entity is only labeled once.Ranged tick enhancements
When rendering in a compressed area, the new ranged tick implementation self tunes to avoid an overlap or non visually pleasing result.
 Pie Labeling Enhancements
In cases where a large number of slices are concentrated in one small section
of the pie the labeling system has been enhanced to ensure each can be cleanly
labeled.
 Multiple Palette support
With the addition of 5 color palettes in 4.4 we have seen requests for
multiple palette support. This new feature enables you to add any number of
palettes to a chart which will be allocated in order as required.
 Axis Tickline linecaps
Line caps are now supported on tick lines and enable enhanced visibility and
improved aesthetics for specific chart applications.
 Category Axis Ranged Tick support
Now ranged ticks can be easily defined on category axis, for example to
select all employees from Bill to Jane. Tick index numbers may also be used to
define ranged ticks.
 Smart Chart Optimization
A dedicated small chart mode enables very small charts ideally suited for
absolute positioning and combination charts. Small charts are also useful for
including in labels as part of the new image label support.
 Optimized Branding Implementation
.netCHARTING is unique in that it offers free development and test licenses
for webforms (asp.net) usage. The "not for production use branding" for this
free license has been enhanced to ensure very small charts remain legible during
development and testing.
Enhanced Documentation
In addition to detailing the extensive new features in .netCHARTING 5.0, the
new documentation now includes an improved programmers' reference which links to
real world sample code.
Enhanced Performance for very large data sets
.netCHARTING is ideal for charts with large amounts of data and chart
elements. The large data set handling has been further enhanced to increase
performance and lower memory requirements.
Version 4.4
Released 9/17/2007
Digital Readout GaugeType
A new gauge type, the digital readout or LCD display, is now supported. This can be used as a stand alone type, in combination with other gauges or even as a label style.
Segmented Bars Type
A new bar type visualization has been added which renders bars as individual segments.
SunBubble Bubble Shading Type
A new bubble shading effect visualization has been added.Variable Transparency PNG backgrounds.
An often requested feature, you can now set variable transparency on different charting visuals and have them apply to each other and also to the page background. For example, set the transparency of the chart background and the chart area will appear to cast its shadow directly on your web page's background.
Box Headers
All boxes now support headers which can also be customized with shading effects.
 Specify
Gauge Sizes
Specify
Gauge Sizes
Gauges can now be arbitrarily sized independent of chart size.
Specify Gauge Rectangles (Absolute positioning)
Gauges can now be placed anywhere on a single chart area and combined into digital dashboards with many other series of different gauge types.
 Label Drop Shadows
Drop shadows can now be added to all text labels and controlled for
distance and diffusion.
 Label Glow effect
All labels now support an optional glow effect which extends a secondary
color glowing outside the original text.
Background ShadingEffectModes
Shading effects can now be applied to backgrounds to add stunning effects anywhere the background object is supported.
Digital Readout Style Labels
In addition to usage as a new charting type, you can now utilize digital readouts for regular chart labels.
 Corner Support for CA
Previously supported for boxes, you can now customize the corners for
chart areas. Corner options include square, cut and rounded.
 Specify box & CA Corner sizes.
A new option has been added to precisely control corner size in pixels.
Element Outline control
Now you can highlight the border of elements (including 3D border outlines) with a simple property setting.
 SeriesCollection.SortElementGroups
Element group sorting enables sort to consider elements that contain
values from multiple series (as in the case of stacked elements). Now
the total stacked value can easily be used to sort elements even if
those elements contain values from other series.
Gradient SmartColors (1-20,Green-Red)
A new SmartColor addition enables seamless transitions between colors across value ranges.
 Smart
Minor Ticks for log scales
Smart
Minor Ticks for log scales
Intelligent addition of significant minor ticks is now supported on log
scales.
ImageBars(tm) OneToOne
ImageBars now stack or expand in size to meet the required total. OneToOne support enables repeating precisely sized image bars to match to the actual chart value so in addition to using the axis you can easily determine the value by counting the number of objects drawn.
 Donut Chart Support in the Multiple
Chart Type
Donut Chart Support in the Multiple
Chart Type
The multiple chart type provides the ability to combine types on a
single chart area quickly and easily with automated layout. Donut charts
are now supported in combination with other types.
5 Color Palettes
In addition to the current library of 50 color palettes, we have added 46 new 5 color palettes. These new palettes are ideally suited for charts with five or fewer series.WinForms Mentor
The charting mentor provides useful tips during development runtime to help tune the chart and adjust settings. Previously only available in the WebForms version, support has now been added to the WinForms version.
Version 4.3
Released 5/10/2007
 Linear
Vertical Gauge Chart Type Added
Linear
Vertical Gauge Chart Type Added
Many new chart types have been added for version 4.3 including
linear vertical gauge. From progress bars to dashboard
applications, this chart type provides a high degree of
customization. It also supports .netCHARTING's innovative
shading effect modes to provide the polish and visual punch of a
3D chart while maintaining the legibility of a 2D chart.
 Linear
Horizontal Gauge Chart Type Added
Linear
Horizontal Gauge Chart Type Added
In addition to vertical orientation, horizontal linear gauge is
supported. Both options include axis marker support which can be
used to optionally indicate value ranges.
 Bars
Gauge Type Added
Bars
Gauge Type Added
A new bars gauge type provides quick summary and comparison of
data particularly useful for polls, statistics and digital
dashboard implementations.
 Indicator
Light Gauge Chart Type Added
Indicator
Light Gauge Chart Type Added
The indicator light or bulb chart type allows for at a
glance status charts. Lights may be shown in combination or with
a single light that changes color based on the value.
 Vertical
and Horizontal Thermometer with shading effects
Vertical
and Horizontal Thermometer with shading effects
The thermometer chart type is a visual variant of the
linear gauge which supports all shading effect modes in both
vertical and horizontal orientations. Thermometers also include
full support for the axis marker system, custom axis ticks and
the ranged tick system providing even more options for data
display.
 Custom Image Gauge Needles
Gauge charts can now use custom images for needles.
Unique to .netCHARTING is its ability to automatically color
custom needles seamlessly to match the element colors used in
the chart.
 Radial Gauge Labels
A new gauge label mode has been added providing radial
labeling for gauges.
 New Chart Types: Nested Pie 2D & 3D
Nested pies (also known as stacked pies) provide a
unique visualization tool for comparing related sets of data.
This new type is supported in both 2D and 3D views.
 Individual Pie Slice Lengths
Now individual pie slice lengths can be varied based on
a separate data independent of the slice total enabling
multidimensional data display.
 Individual Pie Slice Heights
In addition to lengths, pie heights can also be varied
opening up possibilities to show 3 data values per slice.
Nested Pie Scales
Advanced scaling options allow nested pies to render
stacked or overlapping.
 Pie BubbleSize based nested sizing
Nested pies can be sized based on bubble size so each
pie is proportionally sized based on the series level bubble
setting. This setting can be specified on a per series basis or
automatically calculated based on the series total.
Nested pies Spacing Setting
Spacing for nested pies can be adjusted in both 2d and 3d views.
 Image Marker
DynamicColor
Image Marker
DynamicColor
Advanced color replacement technology has been added to
support image marker customization. Now you can provide image
markers and have them dynamically colored based on the chart
element color. The system supports gradients and color
transitions seamlessly so you are not limited to solid color
replacements.
 Gauge Chart Box Settings
The power of the .netCHARTING box has been brought to
the gauge chart to customize the visual container which includes
the gauge.
 Multi color legend box bubble, markers,
and shaded bars Icons
Multi color legend box bubble, markers,
and shaded bars Icons
Legend entry support has been updated to support
multi color bubble, markers, and shaded bar icons.
 New ImageBars(tm)
Furthering the expansive set of included image bars,
version 4.3 adds bamboo, film, tomato, barrel, oil drum, gas
nozzle, bricks, apple, present, paint buckets, pan, paint tube,
box open and closed, glass, banana, rope, fireworks, garbage can
(empty and full), up and down arrows, candy cane, paper clip,
toothpaste, cup, two car perspectives and tape measure. This is
the most significant template addition since .netCHARTING
pioneered ImageBars(tm) nearly a year ago with the release of
.netCHARTING 4.0.
New Samples, Documentation and Mentor Improvements
A huge number of new feature and gallery samples have
been added as well as new documentation and tutorials. Unique to
.netCHARTING 4.3 is a highly tuned set of advanced gauge samples
to enable rapid development and deployment of high end gauge and
dashboard solutions. The .netCHARTING mentor has also been
enhanced to better offer useful tips and information for working
with .netCHARTING.
New in version 4.2
Released 2/12/07
 Stacked
Bubble Type
Stacked
Bubble Type
A new charting type has been added which enables direct
comparison of bubbles sized by value. Multiple shading options
allow for different visualization options for this new charting
type and bubbles can be shaded individually or as a whole.
 Stacked Bubble Alignments
The new stacked bubble type supports stacking bubbles with
center or bottom alignment.
 New
3D shading support for bars, columns and Gantt charts
New
3D shading support for bars, columns and Gantt charts
Shading mode 5 provides stunning visuals optimized for partial
transparency with integrated highlight effects and a high degree
of color constancy.
 New 2D shading support for
bars, columns and Gantt
New 2D shading support for
bars, columns and Gantt
Shading 5 also supports a tuned variant for 2D charts.
 New ImageBars(tm)
Furthering the expansive set of included image bars, version
4.2 adds precious metals including silver, gold, platinum, and
gold bars along with stacked bills (currency), batteries,
binders, cake, chain, paper stacks in 3 variants (chart, plain
and text), a coiled telephone wire and rope.
Bubble
Shape Support
Bubble charts now support a full set of 42 predefined shapes
which like regular bubbles scale in size proportional to their
value.
Funnel
Spacing Percentage
This new setting enables you to add white space between
sections of funnel, pyramid, and cone charts in both 2D and 3D
views.
 Bubble Shape Shading
The new bubble shapes support both 2d and advanced 3d
extruded modes with a flat or eye-catching shaded appearance.
 Multiple
Chart Type
Multiple
Chart Type
The multiple chart type has been expanded to include support
for pie, gauge and stacked bubble charts. Now cone, gauge,
pyramid, pie, stacked bubble, and funnel charts can be mixed and
matched and automatically sized appropriately on a single chart
area.
 Range
Rows Limit
Range
Rows Limit
The advanced automated label system supports adding rows for
x axis ranged labels should they be required to accurately show
the values. This new property enables you to limit the maximum
number of rows the system will utilize.
|
|
||||
Smart Element Grouping Control
A new Boolean option has been added to control the smart
element grouping behavior.
Smart Scale Break Limit
Building on the extensive scale break support, smart scale
breaks now automatically select the number of significant breaks
on the chart based on data ranges. In addition, you can now
limit the maximum number of scale breaks that will be
automatically added by this system.
 Element
coordinates post render
Element
coordinates post render
Now you can obtain element coordinates after the chart has
rendered enabling you to perform advanced drawing operations
making use of this information.
 TrendLineLinearScatter
Calculation Enhanced
TrendLineLinearScatter
Calculation Enhanced
This calculation now automatically supports dates for x
values.
Session Streaming Support
Adding to the streaming and file based options for image
display a new session streaming option is now included. Session
streaming enables those users lacking write permissions within
their deployment environment to automatically create a chart
file in memory and still take advantage of the built in image
map and drill down functionality of .netCHARTING.
DataEngine Datagrid support
Now you can use the built in datagrid population feature of
.netCHARTING with your own datagrid object when working directly
with the data engine.
New in version 4.1
 Major
new chart types including Funnels, Pyramids and Cones.
Major
new chart types including Funnels, Pyramids and Cones.
Powerful new pyramid, funnel and cone charts are now
supported as single charts or groups of charts within a given
chart area. Funnels, pyramids and cones are all supported in 2D
and 3D views with advanced shading for increased visual impact.
 Smarter
Labels
Smarter
Labels
Our innovative Smart Labels just got smarter. .netCHARTING
pioneered the introduction of smart labels in 2003 and 4.1
provides significant enhancements for accuracy and performance
in complex labeling cases. As always, smart labels along with
the full set of enterprise level features, are included with all
versions of .netCHARTING.
 Smart
Annotation Orientation
Smart
Annotation Orientation
Complementary to the smarter smart labels, a new smart
annotation orientation feature has been added which orients
element annotations to minimize overlaps and collisions with
important information on the chart.
 Auto
Label Wrapping
Auto
Label Wrapping
Now labels can intelligently wrap themselves for optimal
display and positioning within a chart.
 Smart
Pie Label Wrapping
Smart
Pie Label Wrapping
Pie labels have specific tuning to automatically handle
wrapping to maximize the size of the actual pie chart within a
chart area while still maintaining clear, legible labels.
 Data Manipulation Enhancements
New options have been introduced which allow you to easily
split or group data using an arbitrary TimeIntervalAdvanced
object.
 New
Combination Pyramid and Cone Charts
New
Combination Pyramid and Cone Charts
New pyramid and cone types are now supported in combo charts.
Combo charts are uniquely powerful in .netCHARTING due to the
number of different charts they can support and enable the
combination of many independent chart types in a single chart
area. The pyramid type appears as a pyramid shape and behaves
similar to the column / bar types.
 New ImageBars(tm)
Expanding the introductory set of image bars included with .netCHARTING
4.0, version 4.1 adds sports balls including soccer, golf,
football, rugby, volleyball, bowling, basketball, baseball,
tennis, hockey puck, in addition a 3d dollar sign, pills,
tablets, coaxial cable, phone cable, ethernet cable, wheat
stalk, pipe, glass figures in blue and pink and a DNA helix.
 Get
Map GPS coordinates from click
Get
Map GPS coordinates from click
Now you can return latitude and longitude coordinates from a
clicked position on a map with no special coding required.
Plot GPS coordinate points on
map
Plot any arbitrary latitude and longitude positions on a
map. Combining with "position from click" and new map marker
support you can now easily build interactive mapping
applications.
 Get
Shapes from a pointer position
Get
Shapes from a pointer position
Easily retrieve a maps shapes for a give pointer position
(e.g. a state along with the information for that shape) by
clicking on a map position or pass a position programmatically
to obtain the shapes and associated metadata for that pixel
position.
 Smart
Forecast
Smart
Forecast
Automated linear forecasts are now
supported with the addition of a single line of code. As
real-time values fill in forecast values you can still see an
indicator of the forecast value both when the actual values fail
to meet the forecast value and when they exceed them.
Smart Element Name Grouping
Common element names can be intelligently sorted based on
their relative order in different series. This is not a sort
based on element naming but rather a pattern matching system
which ensures relative element ordering fits with the series
element orders. For example if you had 3 series each with the
following 3 elements s1:8,4,3 s2:4,3,1 s3:9,7,8 it could group
them as 978431.
 Smarter
Scale Breaks
Smarter
Scale Breaks
In 2005 .netCHARTING was first to innovate automatic scale
breaks. With version 4.1 the built in intelligence for
determining automatic break points has been enhanced and the
support for multiple scale breaks improved as well.LegendBox Column Alignments
Building on .netCHARTING's advanced legend box formatting options, you can now control column alignment on a per column basis to establish the ideal visual balance for your legend appearance.
 Legend
symbols enhanced
Legend
symbols enhanced
Line and spine with markers in the legend now color the
connecting line to match marker color.
Extremely powerful and
flexible XML support
Building on the previous XML support you can now obtain data
directly from any arbitrarily formatted XML document without
special programming knowledge required. Developers who are
familiar with XML can leverage xpath to reference specific nodes
to obtain data from and easily display that data using
datafields and custom attributes. XML may also now be loaded
directly from a file or provided as a string value without any
addition coding required.
 New MS Oracle Client support
Adding to the native Oracle client support already present
the MS oracle client is now also supported so you can select
either client to work with Oracle using the built in database
handling in .netCHARTING.
Accessing Data before Chart
Generation
The data pipeline has been enhanced to allow access to chart
data earlier in the processing pipeline for specific usage cases
enabling data manipulation before chart rendering without the
use of an event or separate DataEngine object.
Easier DataSource Access
A new method has been added for data objects which enables
one to get a DataSource which can be used to evaluate tokens and
populate legend boxes. A datasource may also be obtained from a
hittest in .netCHARTING Winforms Edition. A datasource is a
special container for storing related chart data for use by the
token system or consuming data within the chart such as a legend
box or annotation.
Programmatic Token Replacement
Now you can replace token values in an arbitrary string
using a datasource as the source for token replacement data.
Token system enhancements
New element and series tokens have been added for SeriesElementCount and
ElementCount.
Round() expression
A new expression has been added so that you can round values
shown in labels using the .netCHARTING token system.
Expression escape character
Now expressions can contain any text, including special
control characters which were previously not available.
 Compressed Vector Format
support
Compressed Vector Format
support
Both PDF and SVG now support file compression to minimize
download times. With PDF the compression is automated and with
SVG you have the option to use the uncompressed SVG or
compressed SVGZ format. Since compression is lossless in both
cases, you end up with the exact same vector result with a
smaller file size.
 XAML official support
With the final release of .NET 3.0
official XAML support has been added to .netCHARTING 4.1. If
you have the .NET 3.0 framework distribution and IE installed you can load XAML directly
in the browser for viewing. XAML support will continue to be
enhanced in future versions of .netCHARTING as more developers
embrace this new format.
New in version 4.0
Released 6/29/06
 New
Column (vertical bar) shading
New
Column (vertical bar) shading
A stunning new vertical bar specific shading effect has been
added. .netCHARTING continues to push visual boundaries to
ensure your applications surpass even the next generation visual
standards, soon to be available with new releases including
Microsoft's Vista and Apple's Mac OS X 10.5 operating systems.
 New
Horizontal Bar shading
New
Horizontal Bar shading
A new horizontal bar shading effect has also been added.
 New
bubble shading
New
bubble shading
A major new bubble shading effect has been added with a unique
look and feel only .netCHARTING can provide.
 New shading type support on 3D
Bars
New shading type support on 3D
Bars
In addition to the new shading support for vertical and
horizontal bars, both new and previously supported shading types
are now available on the surface of 3D bars.
 X
and Y Axis Zooming
X
and Y Axis Zooming
A compelling new axis zoom feature has been added which allows
you to define an axis range which will be used for the source of
a zoomed view in a second chart area. This innovative new
feature can also be combined with interactive image map features
of .netCHARTING for drill down zoom functionality.
 Native
PDF Support
Native
PDF Support
An industry first, .netCHARTING supports true native PDF vector
based support. While lesser vendors claim PDF support by placing
a bitmap (picture) image of a chart inside a PDF container, .netCHARTING
includes the actual vector data. Zoom to 6500% and see crystal
clear results or print for razor sharp charts and text at any
size. The included charting control automatically displays the
PDF inline within the web page using the Adobe PDF viewer with
the window sized as chart size. As always, all features of .netCHARTING
4.0, including high end native PDF support, are available for
all 4.0 license holders. This functionality is accessible with
the $395 web site license.
 Native
Flash (SWF) Support
Native
Flash (SWF) Support
In addition to native PDF native Flash (SWF) has been added. The
integrated charting control automatically renders the container
so browsers display the chart inline as a native vector image.
It has never been easier to right click, zoom, click and drag
charts to view the smallest detail. Vector support with small
file size: flash is a powerful Enterprise level addition to .netCHARTING
4.0.
 Native
SVG Support
Native
SVG Support
The new vector support is extremely comprehensive and includes
SVG (Scalable Vector Graphics) as well. The control
automatically renders with the html required to view the chart
using Adobes SVG viewer and it will also prompt to download and
install the plug-in if required.
 Native
XAML support (beta)
Native
XAML support (beta)
.netCHARTING is future proof. Even before the public release of
XAML, (the next generation vector format for Windows Vista /
Windows Presentation Foundation) beta support has been added. As
the specification and development tools finalize for this new
technology it will immediately be fully supported.
 ImageBars
™.netCHARTING continues its tradition of breakthrough innovations with the addition of ImageBars™, which provide stunning themed, pictorial representations in bar form.
 Horizontal
Image Bars
Horizontal
Image Bars
ImageBars™ are also supported for horizontal display for
templates that are well suited for such display.
 Image Bar Templates
.netCHARTING commissioned a group of professional artists to
create 30 image bar templates and all templates are included
with .netCHARTING 4.0 at no additional charge. More image bars
will continue to be added in future releases. If you have an
idea for a new image bar please email the .netCHARTING team.
 New
Mapping Chart Type
New
Mapping Chart Type
A massive new feature of .netCHARTING 4.0 is comprehensive
mapping support. You can now create a map using only 3 lines of
code. Yet don't let the ease of simple mapping mislead you, .netCHARTING's
SmartMap™ functionality provides power and intelligence never
before seen in chart based mapping.
 Support
for Maps with multiple Layers
Support
for Maps with multiple Layers
Maps support unlimited numbers of layers and can accept real
data, readily available online, for the entire globe.
 Satellite
and composite image layer support
Satellite
and composite image layer support
Combine satellite and aerial photography (orthophotos) with your
own map data and other mapping layers on a single map surface.
 Custom
Map Shape Styling
Custom
Map Shape Styling
Style map shapes with background images, line and label options,
custom fills and images.
 Thematic
Mapping
Thematic
Mapping
Display large quantities of spatial data quickly and easily.
Supports color coded ranges as well as custom markers based on
data values.
 Map Zooming
Show multiple views of the same map with zoomed areas. True
vector source and industry standard format support allow for
highly detailed maps from the global level down to a single
property lot.
 Projection
Support
Projection
Support
Maps are a 2D representation of the Earth's surface, which is a
sphere (or more correctly a geoid). Using projections you can
modify the map view to suit customer expectations. Lambert Conic
and Mercator Projections are supported in addition to an
unprojected view.
Map Attribute DataBinding
SmartMaps™ seamlessly support obtaining attribute data, including labels and other data such as population, length, area and much more. Map attribute databinding allows for quick and easy display of this information in tooltips or even on the mapping surface directly.
 Custom Map DataBinding
In addition to data contained within the map itself, you can
bind your own custom data from your own database to the map. You
can also easily combine map data and your own data on the same
map surface.Programmatic Map Shape Access
Maps are created from points, lines and polygons which can be accessed programmatically. The attribute data associated with such shapes can also be accessed in the same way. Easily tune map elements in code with an easy to understand object model.
 Shape
Group labeling and styling
Shape
Group labeling and styling
Shapes can be combined into groups for the purposes of group
labeling or styling based on specific attributes.
 Label
Outlining Support
Label
Outlining Support
Supported in all chart types for all labels, the new label
outline system provides enhanced clarity for labels over busy or
image backgrounds. This feature is particularly well suited for
the new mapping functionality in .netCHARTING 4.0.
 Enhanced
pie and bubble shading
Enhanced
pie and bubble shading
Current pie and bubble shading has been enhanced. We are totally
committed to ensuring the highest visual standards and
frequently revisit old features to improve them in addition to
innovating with totally new features.
 New
Pie Bubble shading support
New
Pie Bubble shading support
Now you can apply bubble shading effects to 2d pie surfaces for
stunning and highly legible pie charts. Enhancing visual impact
without negatively impacting chart clarity is something which is
carefully considered with every new feature or update.New File Handling Features
Building on the advanced streaming and automated file handling of previous versions, .netCHARTING 4.0 adds the ability to access any chart as a memory stream without saving it to disk. In addition, the FileManager now handles saving streams automatically.Event Handler Added
A new OnErrorProcessing event allows special actions to be taken in the case of an error condition with the chart execution.
Native
Oracle support *
Due to popular demand native Oracle support has been added to .netCHARTING.
Now you can connect to your Oracle databases with the built in
series data access system and run all samples against Oracle as
well. Of course, the powerful DataEngine is still available to
utilize .netCHARTING with any database quickly and easily.
 Native
MySQL support *
Native
MySQL support *
Support was added for MySQL databases directly into the
integrated DataEngine and Series level database properties.
 Native
ODBC support *
Native
ODBC support *
In addition to Oracle and MySQL ODBC support was added enabling
quick and easy integration with legacy database systems.
New multi-database sample system *
With the extensive new database support, .netCHARTING samples and associated database information can easily be generated and samples switched from the included MS Access database, to your own SQL server, MySQL or Oracle database with a single line of code. Now you can evaluate and work with the complete and powerful set of .netCHARTING samples using your preferred database backend.
 Chart
Click to Axis Values
Chart
Click to Axis Values
A single click on the map now provides actual X,Y values which
can be used for interactive charting applications. In addition,
axis markers can be used to identify the specific point selected
by the user for real-time visual selection feedback.
 SmartColors
for value ranges
SmartColors
for value ranges
Value ranges define a range of elements that fall within a
specific minimum and maximum value. Used in combination with
SmartColors, .netCHARTING can easily modify colors based on the
range. This feature is ideal for highlighting outlier points or
chart data that beats or falls lower than expected estimates.
 Label Hotspot Support
Hot spots are now supported for labels in addition to the chart
elements they represent. This is particularly useful for cases
with small elements that are not easy to mouse over, such as
very thin pie slices.
 StepLine
Chart Type:
StepLine
Chart Type:
Samples are now included demonstrating creation of StepLine
charts.
|
|
||||

|
|
||||
 New Samples and Documentation
A huge number of new feature and gallery samples have been added
as well as new documentation and tutorials.
 New
palette support
New
palette support
Additional predefined color palettes have been added including
MidRange, VividDark and DarkRainbow which are particularlly well
suited for the new 4.0 bar and bubble shading effects.
*Features available with .NET framework 2.0 only.
New in version 3.4
Released 11/29/2005
 Visual
Studio 2005, .NET Framework 2.0
Visual
Studio 2005, .NET Framework 2.0
and ASP.NET 2.0 Support
With version 3.4 .netCHARTING has a specific release
compiled for Visual Studio 2005 and ASP.NET 2.0. Also, for those
clients not yet ready to move to Framework 2.0 we have 1.x
versions tested and supported in 1.0 and 1.1.
 Powerful
New Combination Charts
Powerful
New Combination Charts
.netCHARTING has always maintained some of the most advanced and
flexible combination chart options (enabling different series
chart types to display together on the same chart area). Version
3.4 greatly expands on this flexibility with horizontal
combination support for marker, line, spline, bubble, area line,
area spline, financial bar, candlestick and more in both 2D and
3D modes.
 Shading
Effects Supported in 3D Charts
Shading
Effects Supported in 3D Charts
.netCHARTING's advanced shading effect support provides stunning
visuals for 2D charts. Now this support has been added to 3D
charts as well, where the effect will apply to the surface of
the chart element.
 Multi-Pie
Labels now have Token Support
Multi-Pie
Labels now have Token Support
Token support has been added for multiple pies enabling run time
replacement of token values and custom string manipulation.
|
|
||||
|
|
New Chart DPI Setting
Setting chart DPI allows one to generate a larger, higher resolution chart image file which is more suited for printing.Maximum Bubble Size Supported
Now you may set a maximum bubble size and have all bubbles in the chart scale proportionally relative to the maximum size.
New in version 3.3
Released 8/3/2005
 Scale Break Styles
.netCHARTING's innovative scale break feature has been enhanced
to support a number of different styles including: gap, line,
zigzag and none. In addition, a line object can be specified to
control all aspects of the line formatting, color, size, dash
style and more.
Weekend Calendar Pattern Support
Calendar patterns are unique patterns to identify specific date ranges or calendar periods. With the addition of a predefined CalendarPattern.Weekends option you can quickly and easily remove all weekends from your chart (for example) which is a common case in the financial industry.
 Scale breaks based on Calendar Pattern
Now it is simple to apply scale breaks based on calendar pattern
with the new Axis.ScaleBreakCalendar pattern property.
 Arithmetic Expressions in
Labels
Arithmetic Expressions in
Labels
Now you can perform common expressions directly within labels
using values from template tokens. For example 100-%YValue to
show a label calculated as 100 minus the total for that elements
Y value. In addition, a new formula token has been added which
enables simple addition of trend line formula in labels.
 Less Intrusive Chart Mentor
The chart mentor provides usage tips based on the settings you
are using in a given chart. This mentor has been enhanced to
take less space and also supports a seamless ‘hide' option. As
always, the mentor is disabled when the mentor property or the
debug property is set to false.Post Render Box Positioning
.netCHARTING now exposes the exact position of any box after rendering. This enables advanced users to perform custom drawing based on the specific positioning of boxes.
 Enhanced Smart Label Alignment
Smart Label Alignment support has been expanded and is now
supported for all series types.
New Label Options
Labels can now be centered on elements and the label contrast for labels on top of columns has been improved.
 2D Line
& Spline Series Gradients
2D Line
& Spline Series Gradients
Like 3D lines and area lines before them, 2D lines now support
seamless gradient transitions between colors.
 New Chart Types – 3D Spline
and 3D Spline Area
New Chart Types – 3D Spline
and 3D Spline Area
Support has been added for 3D spline and spline areas with
enhanced visuals.
 New Spline Tension Support
In addition, both 2D and 3D splines now support customizable
spline tension settings on a per series basis.
 New Background Mode
Brush mode enables a custom brush to be used for a background
fill.
 SaveState / LoadState
The chart object can now be saved to XML at any point and later
restored. This powerful new feature is ideal for templating
cases or for sharing a common set of properties among many
charts. Options include saving to a string or file on disk. This
feature can also be used to save and restore data that does not
change such as last years sales data to enhance performance.
New DataField Support for ErrorData
Enhanced parsing and new mappings have been added enabling automatic population of : ErrorHighValue, ErrorLowValue, ErrorPercent, ErrorPlusPercent, ErrorMinusPercent, ErrorOffset, ErrorPlusOffset, and ErrorMinusOffset.New TimeInterval Support
Minute (Minute by seconds) and Seconds support has been added along with corresponding samples.Automatic DrillDown Enhancements
Enhanced to enable various international date time formats and support seconds.Data input XML support
enhanced
In addition to the previous support for XML datasets the
data property now also accepts XML with attribute and node based
data.
Smart Palette Support
.netCHARTING's numerous 'smart' features use integrated intelligence to enhance your charts - dynamically making changes to improve their look, feel and presentation. The new SmartPalette feature enables element and series color synchronization across multiple chart areas, as well as completely independent chart objects. Color is one of the most effective means of establishing continuity between different charts and now, with a simple setting, you can ensure that "company abc" always shows with the same color.In addition to automatically synchronizing multiple chart areas with a single property setting, you can also save the state of a smart palette to disk or memory and load it back for use in other charts.
Forecasting EngineThe forecasting engine is a subset of the statistics
engine and includes advanced forecasting capabilities
including: |
||
|
Exponential Fitting General Linear Trend Line |
Logarithmic Fitting Non-Linear Trend Line |
Power Fitting Straight Line Fitting |

|
|
||||
|
|
||||
New in version 3.2
Released 4/12/2005
 Polar Chart
Type
Polar Chart
Type
Complete support for polar charts has been added including
advanced rendering support for interpolation of data points when
using a quantitative axis.

Seamlessly integrated
Statistical Analysis
| Advanced statistical calculation support is now built in to .netCHARTING including | ||
|
Mean GeoMean StandardDeviation MeanDeviation Variance Median Percentile25 Percentile50 Percentile75 Range IQR SimpleMovingAverage |
GeometricMovingAverage TriangularMovingAverage LinearlyWeightedMovingAverage ExponentiallyWeightedMovingAverage StatisticalMedianMovingAverage MedianMovingAverage WeightedMovingAverage Kairi ZScore LowerBollingerBands UpperBollingerBands BollingerBands CorrelationCoefDeterminantion |
KendallCorrelationCoef PearsonCorrelationCoef SpearmanRankCorrelationTest LeastSquaresEstimateY LeastSquaresEstimateX CFrequencyTableAOL CFrequencyTableAOR CFrequencyTableBOL CFrequencyTableBOR FrequencyTableOL FrequencyTableOR RFrequencyTableOL RFrequencyTableOR |
Seamlessly Integrated
Financial Indicators
| All major financial indicators have been integrated and samples added for advanced multiple chart area financial and stock charts. Indicators include | ||
|
Mean GeoMean StandardDeviation MeanDeviation Variance Median Percentile25 Percentile50 Percentile75 Range InterQuartileRange SimpleMovingAverage GeometricMovingAverage |
TriangularMovingAverage LinearMovingAverage ExponentiallyWeightedMovingAverage MedianMovingAverage WeightedMovingAverage FinancialZScore LowerBollingerBands UpperBollingerBands BollingerBands AcumulateDistributeOverPeriod ChaikinOscillator ChaikinMoneyFlowOverPeriod CommodityChannelIdxOverPeriod |
MedianPrice TypicalPrice AroonUp AroonUpOverPeriod AroonDown AroonDownOverPeriod AroonOscillator AroonOscillatorOverPeriod BalanceOfPowerOverPeriod MoneyFlowIdxOverPeriod Momentum Kairi |
 Stacked Radar Columns
In addition to polar chart support, radars have been
enhanced with support for the stacked axis scale.
 Radar Axis Enhancements
Now radar charts have complete support for date and numeric
x and y axis.
 Radar
Line Interpolation
Radar
Line Interpolation
Radar lines are interpolated between data points. This
conveys a more accurate representation of quantitative values
between data points.
Radar
Axis Orientation
Radar charts now supports orientation angle and X Axis markers.
 Calculated Axis Ticks Shortcut
A new shortcut method has been added to enable quick and
easy addition of
calculated axis ticks -- for example a tick for a series
average.
 Axis Marker Bring to Front
A new property has been added which will enable you to bring
a given axis
marker to the front; automatically placing other chart elements
behind it.
 Radar Gridline Support Enhanced
Alternating gridline colors are now supported for radar X Axes.
 Include Grouping Data in Sub Values
A new feature has been added to automatically populate sub
values based on
the original values grouping calculations are made from. For
example, if
grouping by month a number of data points may be aggregated for
that month.
When enabled this feature will populate the sub values for that
month so the
individual values that makeup the element could be shown in
addition the
element total.
DataEngine Support for XmlDocument
XmlDocument is now supported as a data source when using the Data
property.
Automated Multiple Series Drilldown Support
A new feature has been added to support drilldown into
multiple series for
all date grouping levels. This option determines if drill down
occurs into
individual series or the series grouping. When drilling down
into a series
grouping all available series will be shown in each hierarchy of
the
drilldown chain.
Advanced Limit Support
Now limit can be bound to a specific series. When using this
feature first
the series will be limited based on the specified value, then
.netCHARTING
will automatically match any remaining series to that limit
order rather
than limiting for each series independently.
DataEngine Enhancements
GetSeries now handles Boolean for xAxis or xAxisStart when loading from a database. Also, GetSeries has been enhanced to support display of full months of data when using irregular StartDate and EndDate values (mid-month for example).
New in version 3.1
Released 2/28/2005
Element
Marker Visibility
You can now adjust the visibility of element markers with a
single property setting allowing control at the chart, series or
individual element level.
 Minor
Tick Control
Minor
Tick Control
The addition of Minor tick marks was well received in
version 3.0, now in 3.1 complete control over minor ticks has
been provided. In addition a new smart
minor tick implementation has been added which
automatically determines an ideal minor tick interval based on
the major tick interval used. As always, automated settings can
be overridden providing an high level control over the
appearance and functionality of any given chart.
 Smart
Scale Breaks With Markers
Smart
Scale Breaks With Markers
.netCHARTING's innovative smart scale break technology has
been enhanced to work seamlessly with axis markers.
 New
Chart Mentor
New
Chart Mentor
The chart mentor offers useful tips and samples based on the
chart you are creating. It can help you resolve problems and
improve the implementation of your chart in the most efficient
way.
 Specify
Line cap scale
Specify
Line cap scale
The relative scale of the line cap (based on line thickness)
can now be set.
 Printer
Optimized Text rendering
Printer
Optimized Text rendering
A new setting is available to automatically optimize text
output for printing.
 Multi-Color
Legend Entry Support
Multi-Color
Legend Entry Support
When legend entries represent a series containing multiple
elements with different colors legend entries will now show with
the first 3 colors to ease identification.
 Enhanced
Token Support
Enhanced
Token Support
Value tokens can now be used in axis ticks with value axes.
In addition, the Xvalue token now automatically populates using
Name if another value is not provided. Tokens can now be escaped
or excluded by prefixing them with a forward slash.
Gridline defaults in Calculated
Axes
Calculated axes now draw gridlines without alternating fills
to enhance readability.
 Error
Bar and Error Value Support
Error
Bar and Error Value Support
Complete support for error bars and values has been added
along with support to automatically populate element error
properties from your own database. As part of a comprehensive
system for representing errors in collected data, .netCHARTING
now supports multiple sub values with rendering as error bars,
lines and markers.
 HTML
Event Attributes
HTML
Event Attributes
A complete system for adding HTML event attributes has been
added. Now you can easily define custom DHTML tool tips, use
JavaScript alerts and message boxes, set the status bar text and
even define your own custom handling client side handling with
ease.
Arbitrary Tick Addition
A new shortcut method has been added which enables you to
add a list of arbitrary ticks to an axis using a single line of
code.
 Enhanced
Range Tick Rendering
Enhanced
Range Tick Rendering
The ChartEngine has been enhanced with regards to ranged
tick rendering to ensure optimal spacing and alignment
regardless of usage scenario. In addition, ranged ticks can be
tailored to your specific needs with advanced interval support,
along with line and label customization.
 Additional
FormatString support
Additional
FormatString support
Format strings are used by .netCHARTING to take inputs, such
as dates, and format them into different string representations.
New custom format string support has been added for Q which
returns quarter numbers and O which returns ordinal numbers
(1st, 2nd, 3rd etc.) for both numeric and date values.
 Axis
Tick Label Angle
Axis
Tick Label Angle
Axis ticks are angled if they would otherwise overlap when
rendered parallel to the axis. You can now provide a custom
angle for labels to use.
 Duplicate
Axis Support
Duplicate
Axis Support
In addition to the extensive calculation support which
enables axis to be calculated and converted using hundreds of
built in unit conversions, .netCHARTING now also supports
duplicate axis. These axis are the same as the original and are
useful when you wish to have the same axis on both sides of a
wide chart. In this way, one can read values off the closest
axis to the element they are interested in.
 Color
From Settings
Color
From Settings
Using built in palette support colors are often
automatically assigned by the ChartEngine. New shortcut
properties have been added to set colors of series or elements
from other series or elements. This can be useful when manually
adding calculated elements, for example, and wishing the color
to synchronize with a given series.
 Time
Label Automation
Time
Label Automation
A unique feature which quickly, intuitively, and with a minimum
of labels, conveys time related data on the axis. For example
when showing 26 months it is not necessary to repeat the year
for every month. In this scenario, the automation feature will
automatically render relevant data across “significant date”
boundaries. Used in conjunction with ranged tick support Time
Label Automation provides a stunning, easy to read, axis that
elegantly handles continuous date ranges using indicator arrows.
Additional Data Engine DataType Support
The DataEngine.Data and Series.Data properties now support all objects that implement IEnumerable, ArrayList and HashTable. This enables nearly any data source to be bound to the chart with a single property setting adding to the currently supported DataTable, DataSet, DataView, DataReader, XML and Excel types.
Simple Series Creation per Column
New DataFields support enables the addition of multiple series from a single table using one line of code. With this addition, multiple YValue data definitions are supported in which case each will automatically generate its own series.
 Total
Series and Total Elements Support
Total
Series and Total Elements Support
New properties have been provided to return the total series and
element counts to aid simplified paging through chart data.
New in version 3.0
Released 11/18/2004
 Multiple
Chart Area Support
Multiple
Chart Area Support
Now you can have multiple independent chart areas within a
single chart image. Advanced automatic alignment functionality
enables a single axis to span multiple chart areas and
automatically align with each other. Now creating perfectly
aligned charts with a shared axis is quick and simple.
 Chart
Area Sizing
Chart
Area Sizing
With the addition of multiple chart area support comes
advanced sizing options. Chart areas can be sized relative to
each other by percentage and orientated within a grid layout.
Automatic Drilldown into
“Other” data
.netCHARTING offers the ability to limit elements and new
series created by its unique SplitBy technology. The result is
the automatic creation of an “other” series which contains all
data not included in the chart as a single element or new
series. Now you can automatically drill down into this “other”
data. New limit modes have also been added in addition to
limiting the return to the Top x values you can now limit to
bottom, exclude top and exclude bottom as well.
Axis Minimum and Maximum
support enhanced
Now you can set minimum and maximum scales for log and time
scale axis.
 Log
scale now supports any power
Log
scale now supports any power
Now you can set the logarithmic base to any power in
addition to the default log 10 support. For example base 2, base
5 etc.
 Axis
Minimum Interval
Axis
Minimum Interval
Set a minimum interval to ensure that the axis does not
scale below your unit of business. For example, if you sell
units which can not be divided, now you can ensure the axis will
at minimum increment by one.
 Inverted
Scale Support
Inverted
Scale Support
Creating inverted charts has never been easier! By selecting
the inverted scale you can now draw charts from the top down.
 Automatic
and Custom Time interval Support
Automatic
and Custom Time interval Support
Now you can set custom axis intervals even while using the
time axis. In addition, the automated interval system has now
been enhanced for time axis.
 Arbitrary
Ticks and AxisMarkers can now affect scale range
Arbitrary
Ticks and AxisMarkers can now affect scale range
.netCHARTING has intelligent automatic scale generation to
select the best range possible based on the chart data.
Occasionally you may wish axis ticks or AxisMarkers to be
included in the automated scale range calculation. Now you can
ensure important ticks or markers are always included in your
scale with a simple setting.
 Smart
Scale Breaks
Smart
Scale Breaks
Often a chart has a few outlier data points which result in
charts that are not legible for the bulk of the data. For
example, if you had a chart of 100 values between 1 and 10 but 2
of the values were over 1,000 you could not accurately determine
the values due to a compressed scale. Smart Scale Breaks
automatically break the scale to cut out large unused sections
so both lower and upper values can be clearly read.
Scale Breaks
In addition to Smart Scale Breaks regular scale breaks can
be defined if you wish to break the scale at any arbitrary
point.
 Element,
Axis Marker and Arbitrary Tick Support
Element,
Axis Marker and Arbitrary Tick Support
Now you can define arbitrary tick marks on the axis with
their own gridlines. In addition ticks can be defined for
specific elements and axis markers.
 Ranged
Tick Support:
Ranged
Tick Support:
An axis tick typically represents and labels a single value
on an axis. Ranged ticks show a range of values on the axis, and
are also known as an axis group. For example on a chart of
months you could have 12 ticks, one for each month and then 4
ranged ticks showing each quarter. Ranged ticks could also be
used to highlight specific data in conjunction with Axis
Markers.
New Tick Formatting Options
Now you can set Color, Font / Tick Line & length and Grid
Line on a per tick basis.
 Axis
Tick Ranged Overrides
Axis
Tick Ranged Overrides
You can also modify the settings of a range of ticks by
value to affect tick formatting for a subset of individual axis
ticks.
 Image
Tick Support
Image
Tick Support
In addition to text or label based ticks you can use images
in place of tick labels. For example, you could use a countries
flag in place of country name on an axis.
 Axis
Label and Tick Alignment
Axis
Label and Tick Alignment
New alignment options enable labels and tick alignment to be
adjusted to suit your specific needs.
 New
Axis Orientation
New
Axis Orientation
Axis can now be displayed on the top of charts rather than
the bottom which is the default. You can also now have multiple
axis on the left, right, top of bottom of the chart!
 Axis
Label Token Support
Axis
Label Token Support
Now .netCHARTING's powerful token system can be used in Axis
Labels enabling you to dynamically change axis labels based on
token values.
 Radar
Charts Enhanced
Radar
Charts Enhanced
Now with multiple radars each radar can have its own axis.
In addition, time axis and bubbles are supported on radar
charts.
 Scatter
Charts Enhanced
Scatter
Charts Enhanced
All series types are now allowed on scatter charts in addition
to the previously included bubble and marker support.
 Financial
Charts Enhanced
Financial
Charts Enhanced
Now financial chart types may be used in combination charts and
powerful multiple area support provides increased power and
flexibly for financial charts.
 New
Label Alignment support
New
Label Alignment support
Now you can adjust label alignment for labels including chart
area, title, axis and axis marker labels.
 Legend
Box Enhancements
Legend
Box Enhancements
Massive enhancements have been made to the legend box including
the ability to sort entries, show divider lines between entries,
add headers, and add formal legend entries on a per entry basis.
Legend boxes can now be positioned arbitrarily on the chart
surface, even inside the chart area and can be orientated
anywhere around the chart using predefined settings. Multiple
legend boxes are now supported with the ability to add entries
to any given legend box.
 Custom
Attribute support for Legend Boxes
Custom
Attribute support for Legend Boxes
In addition to the powerful new visualization options for legend
boxes a new data subsystem has been added which supports tokens
and custom attributes support. This means you can have your own
custom data pulled from a database or set programmatically
display in the legend box with ease.
 Absolute
Legend Box Positioning
Absolute
Legend Box Positioning
In addition to the extensive orientation options for the legend
box, .netCHARTING now supports absolute positioning anywhere on
the chart with pixel level precision. Combined with background
transparency, this feature enables attractive placement within
the chart area or anywhere on the chart surface you please.
 Background
Shading Effect
Background
Shading Effect
A new background specific shading effect has been added.
 Calendar
Pattern Support
Calendar
Pattern Support
Now you can define custom calendar patterns to implement
axis markers. Calendar patterns will enable you to highlight a
specific event or region of your data which reoccurs including
marking weekends or other recurring events.
Calendar Pattern Trimming
In addition to highlighting data, you can also trim values
using calendar patterns. Using the previous example you could
remove weekend data altogether in place of highlighting data
during the week.PostDataProcessing Event
A new event has been added which enables developers to programmatically manipulate chart data after it has been processed by the DataEngine but before the chart has been rendered.SeriesCollection.GetProcessedDataTable
A new method has been added which returns a dataTable of the processed data. This is useful to access the data for other purposes after the ChartEngine has processed it.Start Date of Year
In addition to the ability to determine the start day of the week for automated week grouping functionality of the DataEngine, you can now use StartDateOfYear to control month start for years and quarters.
Include In Axis Scale
Often important thresholds are represented with axis markers and custom tick marks however if the data does not fall within range of these values they would not be visible on the chart. For the cases you wish to always show such values a new property has been provided. With a simple setting you can now ensure that the axis scale takes into account your axis marker or tick.For example if showing a chart of bandwidth or file space usage you may wish to always include an axis marker indicating the maximum usage allowed, even if the users current usage would not normally include such values on the scale.
New in version 2.5
Released 6/14/2004
 Gauge and Dial Charts
A stunning new gauge / dial chart type has been added. In
addition to supporting a single chart, multiple gauges can be
added for instant executive dashboard implementations. Many
advanced features are supported with this new type including
quarter, half or arbitrary sized gauges, with and without
clipping, and 3d highlight effects.
 Axis Label Marker Support
The new gauge type supports addition of a
custom marker on the gauge face using this property.
Cleanup Minimum Age
Continuing the enhancement of the automated cleanup
functionality available since the first version release, you can
now specify minimum age to prevent deletion of specific files
until they reach this age, for example, 30 minutes old.
Date Grouping Calculation Support
The date grouping functionality allows data to be easily
grouped by date classes such as months, days, hours, years,
quarters etc. It allows the same data to be visualized different
ways with no custom programming required. Previously
.netCHARTING would automatically aggregate (sum) values but now
extensive arithmetic operations are supported including average,
minimum, maximum and many more.
New Color Token
Building on the powerful token system a 'color' token has
been added. This powerful new feature enables you to maintain
color synchronization in drill down charts with ease. In
addition, the built-in automated drill down now automatically
supports this feature.
ImageMap and ImageMapName Exposed
For those clients that demand complete control .netCHARTING
does not disappoint. Version 2.5 exposes the ImageMap text and
ImageMap name which, used in conjunction with FileManager, allow
you to customize images and independently assign image map data
generated by the chart engine.
 Per Element Hatch Style Support
Now you can customize elements with hatch styles, ideal for
differentiating elements for black and white display or for
those who are color blind. In addition to the specific hatch
pattern used, you can also define element specific hatch
coloring which can be set independent of the item color.
HatchStyle Palette and HatchStyle Palette Name Support
To complement the extensive per element hatch style support,
.netCHARTING now provides the ability to define custom groups of
hatch styles which are assigned, in order, to elements / series
just as a color palette assigns colors. In addition, 5
predefined hatch style palette names are included to quickly and
easily assign unique hatch styles using a single setting.
 Series Background Support
A new background option has been added for series. This
enables powerful background options for the new gauge / dial
charts. For example, you could place a photograph of a real
gauge in the background and have the needle be set dynamically
based on the provided value. .netCHARTING will seamlessly merge
the generated needle and background for photorealistic gauge
renderings.
 Annotation Text Alignment
New alignment support enables you to directly control the
alignment of annotations in both the horizontal and vertical
directions. Alignment options include left, right, center, top,
bottom and middle.
Tiff Image Format Support
Now you can output 'lossless' tiff files with a simple
property setting.
Vector Based Image Support
Have you wanted to print massive charts or zoom into the
smallest detail without loss of quality? Now you can with native
vector image support.
Output charts as Enhanced Meta Files (EMF) and scale as large as
you wish.
Series Collection Sorting
Now with a single method call you can sort series within the series collection. This new feature is particularly useful for 3D charts where it is advantageous to sort series in order to aid aesthetics such as a 3D area line chart (where keeping smaller series at the front enables them to be seen clearly).Series Area Line Label Enhancements
Now series area line labels support label alignment similar to the new alignment support added to annotations.Developer Version SmartBranding Added
The fully functional free developers version is branded not for production use. Typically this does not affect chart elements however with very small charts common in executive dashboards the branding can obscure part of the chart. With version 2.5, .netCHARTING will intelligently vary the branding transparency in such cases to ensure the chart can be visualized effectively in all scenarios.Enhanced Annotation 'CallOut' Support
In addition to the previously supported top left, top right, bottom right and bottom left callout positioning, annotations now support callouts from the left, right, top and bottom. Combined with the new annotation text alignment features and advanced token system there are thousands of annotation variations now possible.
New in version 2.4
Released 4/14/2004
 Axis
Label wrapping
Axis
Label wrapping
Labels on both the X and Y axis can now be set to automatically
wrap horizontally, display on an angle or display perpendicular
to the axis.
 Axis
Label Separators
Axis
Label Separators
To make the separation between tick marks clear, particularly
when the new wrapping functionality is used, label separators
can be added. Options are provided to control the line, style
and color for such separators.
 Custom
Element Attributes
Custom
Element Attributes
Now you can define any number of custom attributes for your
chart elements.In addition to the extensive built in element attributes such as color, font, line, transparency values, URL and many others, you can set your own custom values to be stored on a per element basis. Enhanced template support enables you to utilize your own custom data in any property that supports element templates such as annotation, URL, tool-tip, and name.
Date Grouping Sort
A new option for date grouping is now provided to control the sort order behavior. Date grouping is a powerful feature for grouping values into specific date ranges such as years, quarters, months, days and more.Data Grid Header Template Support
In addition to stunning chart images, the data represented in the chart can be displayed automatically in a data grid in tabular form. This is useful for meeting accessibility requirements and easily allowing users to copy chart data as text. Now you can have the header set automatically based on chart data with new template support. This is particularly useful for drilldown charts or any chart where data changes dynamically.
 Label
trimming
Label
trimming
Advanced label trimming has been added, allowing you to finely
tune the visuals of labels that are too long to display well on
the chart. You can now set a maximum length for labels, control
the string used to terminate a truncated value e.g. "this is a
long." and determine if labels will be truncated from the start,
middle or end.
Simple database connectivity just got simpler
Now you can specify the file name of your access database or excel spreadsheet and .netCHARTING will be able to produce stunning charts from it directly with no complicated connection string or additional technical requirements.Chart URL Mapping Enhanced
Define chart level URL for any surface of the chart to have a hyperlink while maintaining the functionality of any higher level hyperlinks that may be set for elements, legend entries, annotations and more.Empty Element Handing for DataGrid Values
.netCHARTING has built in support for empty elements and can represent them in a number of different ways visually, or via labels. Now, when empty elements are included in a DataGrid view of your chart data they are seamlessly replaced with your own custom text value as defined with EmptyElementLabel.
 Axis
Label Rotation
Axis
Label Rotation
Now you can rotate the Y axis label to read either bottom to top
or top to bottom. The ChartEngine will also automatically select
the most appropriate setting for each axis if not overridden.
New Palettes
Many new palettes have been added allowing you to chart with a variety of color schemes using one simple setting. As always, you can create your own palettes as well as set palettes at a chart or series level.Enhanced documentation and Samples
More resources are now available to help you get the most out of .netCHARTING!
New in version 2.3
Released 1/26/2004
 Advanced
Empty Element Handling
Advanced
Empty Element Handling
Empty elements have always been handling intelligently and
treated differently from 0 elements by .netCHARTING. An empty
element is an element with no value which the chart will
automatically render breaks for in lines and area lines. New
features have been added enabling you to control how empty
elements are displayed with custom markers, styles, lines,
color, text notation and more! Empty elements may now also be
replaced, automatically treated as zero, filled or ignored.
 Multicolor
Area Lines
Multicolor
Area Lines
This unique feature allows area lines with multiple colors
to seamlessly blend together providing powerful visual queues in
the chart image.
 Annotation
Support
Annotation
Support
A powerful new annotation system has been added which allows
for custom messages to be displayed on the chart surface.
Annotations may be attached to any element with custom
orientation, made clickable and also display tool tips.
Annotations accept tokens which are automatically replaced by
chart data on the fly from series, axis or element information.
Pure image annotations are also supported allowing for image
layering with variable transparency.
Bitmap Image
Access
To aid in simplified integration with reporting and PDF
tools .netCHARTING now has a simple method for obtaining the
entire chart as a bitmap.
Advanced Post Processing Support
You can now get the chart image in a bitmap with one simple step allowing for powerful post render operations on the chart. Calculated coordinate information is returned for chart elements allowing for powerful custom image post processing and a simple method is provided to automatically save the file for output.Legend Image
Support
Along with the chart image, you can now access the legend as
a separate bitmap. This allows you to use the chart and legend
images independently and reference them directly in your page
for even more flexible layouts.
 Fixed
Column Width
Fixed
Column Width
By default column / bar width is automatically determined based
on the number of elements and size of the chart created. You can
now specify a fixed width which is useful when you want a
consistent size in different charts or with drill down. Ranged Area Line
The ranged chart type enables you to set start and end values for a chart. This powerful charting type previously available for other types is now also supported with area lines.Enhanced Pie Labeling
With .netCHARTING Image is Essential and pie labeling has been further enhanced to ensure optimal alignment.Enhanced Hotspot Support
Now even the smallest values are accessible for drilldown, hyperlink or tool tip support with enhanced hotspot support.
 Background
Bevel Shading
Background
Bevel Shading
A stunning new background option is supported which creates an
attractive bevel on any background.
New Palettes
Additional predefined palettes have been added allowing for simple selection of attractive color schemes. Palettes can be set at a chart or series level (in which case each element takes on a palette color)New Samples and Documentation
Many new samples have been added and documentation has been enhanced.
 Trend
Line Support
Trend
Line Support
Trend line series can now be calculated with a single line of
code. In addition to calculating a trend line for included data,
.netCHARTING can optionally extend the trend line outwards
beyond the actual data as a predictor.
New in version 2.2
Released 10/29/2003
 Series
and Element Level Legend Entries
Series
and Element Level Legend Entries
Now you can easily add legend entries for individual elements or
series and control all aspects of legend entries individually.
Legend entries can also be removed with a new visible property
setting.
 Legend
Entry ToolTip and DrillDown Support
Legend
Entry ToolTip and DrillDown Support
Legend entries may now be used for tooltip (showing additional
data on mouse over) or drill down functionality.
Series Level Palette Support
A new PaletteName property at the series level allows you to have colors assigned on a per element basis within a series with one simple setting. Ideal for creating high impact single series charts the new system also automatically adds legend entries for each element rather than for the single series in such a case.
 Axis
Tick Label Templates
Axis
Tick Label Templates
The powerful .netCHARTING template system has been extended to
support full tick label templates. Now you can format and
display your data in tick labels exactly as you please.Enhanced Element Template System
The element template system has been enhanced with many more data values now available for use throughout .netCHARTING.
 Format
on the fly in Templates
Format
on the fly in Templates
On the fly formatting enables you to embed format string
settings for a given template token to ensure the data is
represented exactly as you want it without requiring manual
formatting.
 Automated Series
Sorting
Automated Series
Sorting
Now you can sort elements within a series with a simple method
call.
Data Trimming
based on set ranges
This powerful new data manipulation method enables you to remove
elements outside a specific date or number range.
Series data manipulation with operators
Now series and elements can be manipulated programmatically with arithmetic operators. Add, subtract, multiple and divide any series or element with any other or fixed numbers.
 Automatic axis
number precision
Automatic axis
number precision
When the tick mark interval is less than one .netCHARTING will
now automatically set the appropriate level of precision for
axis numbers.
 Enhanced Design
Time Support
Enhanced Design
Time Support
Now supports declarative code generation and new properties
editor GUI sections for customizing chart options. In addition,
changes made to the declarative code directly will be reflected
in the designer environment.Selectable First Day Of Week
.netCHARTING's built in date grouping and DataEngine support has further been enhanced with a user definable start day of week. This new setting allows weekly data to be grouped correctly, exactly as you wish, be it Sunday to Saturday, Monday to Sunday or any other permutation.New Clear Color Settings
New shortcut settings enable the colors to be cleared with a simple property so they may be selectively enabled in a customized fashion.
New in version 2.1
>Released 9/30/2003
New
Bar Visual Effects
Two stunning new visual effects have been added for 2D bars.
These unique visuals add a 3D visual punch to 2D charts. Now you
can satisfy your clients with a stunning 3D effect while
maintaining the ease of readability you have come to expect from
2D charts.
Enhanced Image Map Support
Image map render order has been improved to more eloquently handle overlapping conditions.
 New
Bubble Visual Effects
New
Bubble Visual Effects
Two new bubble shading options have been added to provide your
charts even more visual punch.
 Shaded
Legend Icon Support
Shaded
Legend Icon Support
Legend icons are now synchronized with the chart element's
shading effects allowing for quick and easy identification of an
element from its legend entry.
Maximum Bubble Size Control
You can now control the maximum bubble size and have all bubbles rendered relative to this maximum size.
 Per
element label controls
Per
element label controls
Now labels can be controlled on a per element basis with
settings for color, font, size, alignment and more!
Enhanced Smart Label Functionality
The label system has been enhanced dramatically and now supports conditional label inclusion depending on spacing, forced label rendering, set vertical rendering and control over label alignment.Enhanced documentation and Samples
More resources are now available to help you get the most out of .netCHARTING!New in version 2.0
Released 8/11/2003
Drill Down
Support Enables “Clickable” Charts
Complete drill down support is now provided with advanced
automatic drill down functionality using our own unique date
grouping functionality. Now you can create multi level drill
down charts from your own dynamic database in as few as 10 lines
of code! Adding drill down support to a chart is as simple as
one line – a single property setting! In addition to the
automated drill down functionality, complete programmatic
control is provided along with a template system for drill down
URL to enable passing information on the selected element for
subsequent drill down actions. Drill down has never been so
simple, or so powerful!
ToolTip Support
Along with drill down support tool tips are now supported on a
per element basis. This allows additional information to be
displayed when the user rests the cursor over a given element.
Through the ToolTip template you can control 30 different values
which are automatically set when the chart renders. You can
also set the ToolTip automatically from a field in your database
with additional information or comments you wish to display to
the user but don't want to clutter your chart with.
 3D
Chart Depth Control
3D
Chart Depth Control
This
new property allows you to control the depth of charts when
rendered in 3D modes. You can now control the width, length and
depth of charts with ease.
Smart Label
Support
The
new “smart label” system ensures that labels do not collide or
overlap even when chart elements are very close to each other.
A small pointer is used to reference the element being labeled
and the text is rendered on a portion of the chart with space
for the label to be displayed. You have complete control over
the indicator line color, thickness and style used along with
the end cap / pointer included.
 Complete
Per Element Controls
Complete
Per Element Controls
Now
you can control all expects of the chart down to the element
level with complete per element controls. Settings include the
color, marker, label, url, tooltip, transparency, labeling and
much more. Now it is simple to vary colors on a per element
basis or make changes to elements programmatically based on
their value. For example: iterate through the elements
collection and change all elements between 0 and 30 to green,
30-50 to yellow, 50-80 to orange and 80-100 to red. You have
complete control over all settings providing an exceptional
level of flexibility.
 Alternating
Axis Grids
Alternating
Axis Grids
You
can now set and independently control the axis and alternating
axis grids even specifying the background color / image of the
axis grids.
 Axis
Markers
Axis
Markers
Many
times a chart has a unique value which is significant but not
directly represented by an element on the chart. For example,
it could be a date when a specific promotion began, some other
event or a special value (break even point, boiling point etc).
With the new axis marker functionality you can mark specific
points on any axis and even define ranges (for example
weekends). With the advanced marker range background support
you can also highlight such areas with any color or image
background you wish. Of course you also have complete control
of the axis marker line color, thickness and style.
Unlimited Axis
and Axis Binding Support
Now
unlimited x and y axis are supported for any given chart.
Better still, each series can be independently bound to a given
axis effectively allow multiple independent charts to display on
the same charting surface. This feature is also very useful
alongside the powerful combination charting options which allow
different chart types to display at the same time in both 2D and
3D views.
 New
Calculate Axis Support
New
Calculate Axis Support
Along with unlimited axis support comes a powerful new concept
in axis creation – the calculated axis. Often charts will
display established units such as temperature, distance, weight
etc. The calculate axis functionality allows you to create a
new axis based on another axis with different units, all with
one simple setting. Have a chart of distance in miles? Add a
calculated axis with kilometers, yards or feet. Over 1000
different unit conversions are built in and you can define your
own functions for unlimited flexibility. Process numeric
values: 1, 2 ,3 into numeric names: one, two, three. Process
your own conversions with your own custom functions – the
possibilities are endless! In addition, you can calculate a new
time based axis from one time interface (years) to another
(quarters) with the same simple to use system.
 Complete
Per Axis Controls
Complete
Per Axis Controls
Now
every feature you can imagine is supported at the axis level
with complete per axis controls. Independently set the axis
line, background and alternating background, range markers,
value markers, tick label overrides, cluster columns per axis,
format and culture settings, grid lines, minimum, maximum,
interval, padding, orientation, percentage, position (order),
scale and much more.
 Line
Object Support
Line
Object Support
A
new line object enables you to control all aspects of lines used
to draw the Title Box, Chart Box, Legend Box, Chart Interior
(from 3D mode), smart label pointers and many other areas.
New Background
Options
Apply backgrounds to axis markers to highlight a specific range
or value on the chart. In addition, backgrounds can be applied
to alternating axis grids for a unique and powerful visual
impact. The background object has also been enhanced offering
new hatch style and hatch color support in addition to the
established solid color, gradient, scaled image and tiled image
options.
 Legend
Template Support
Legend
Template Support
Now
you can control the order, distribution and appearance of the
legend entries with a powerful yet simple to use template
system. Include the series name, the series value, and icon
along with your own text.
 Custom
Legend Entries and Icons
Custom
Legend Entries and Icons
Add
an unlimited number of custom legend entries with independent
text and marker details. This feature is useful for notes on
custom markers that have been placed on the chart or to
highlight a specific element with additional information.
Combined with the new per element controls this functionality
enables detailed information to be displayed on customized
elements. You can further customize the legend appearance by
defining custom legend icons.
 Horizontal
Cylinder Charting Type
Horizontal
Cylinder Charting Type
A
stunning new horizontal cylinder charting type includes support
for percent complete hatching. Cylinder Gantt charts are also
possible with the new range support.
Financial
Charting Types
Stunning stock charts are now supported with series options for
open, close, high, low, financial bar, Candlestick, and High Low
Area in Volume chart areas as well as independent price / volume
time intervals. New stock specific marker types have been added
including split, reverse split, merger, dividend and spin-off.
Of course you can specify any custom marker as well on a per
element basis.
 Donut
Charting Type
Donut
Charting Type
A
visually pleasing new donut charting type has been added. With
complete 2D and 3D support this type also allows for
transparency control for a very aesthetically pleasing chart.
 Extensive
New Pie Options
Extensive
New Pie Options
A
powerful new labeling system, combined with smart labels,
provides some of the most attractive and legible pies ever
rendered. Labels can be rendered outside the pie with pointers
to the representative slice, render inside the slice when there
is room or automatically render inside or outside on best fit
and appearance. In addition, pie slices can be individually
controlled and exploded with per slice controls for exploded
distance.
 Range
Charting Support
Range
Charting Support
Now
bar, cylinder, column and other charts support elements with
start and end values. This enables a column that starts at a
value greater than zero, for example, and allows for effective
and attractive display of ranged data.
 Powerful
Element Templates
Powerful
Element Templates
Along with the complete per element controls comes a new
template system with 30 template containers. Templates can be
controlled on a per element basis and are supported for element
value, URL, and ToolTip. For example: &Value will display the
item value as a ToolTip (so when you hover your mouse over the
element you will see the value). If you set &Value for the
element value you would see the actual value rendered on the
chart. You can also use any number of template containers
within any template along with your own text, for example,
“Name: &Name, Value: &Value”. Template containers are
automatically replaced with the elements name, value etc. when
the chart is created.
 New
Marker System
New
Marker System
A powerful new marker
system provides an extensive set of 15 marker types in addition
to support for any custom marker. Using built in markers you can
control the color and size independently on a per marker basis.
Markers are now used extensively throughout the product and
allow for simple per series or per element customization.
 Custom
Marker Support
Custom
Marker Support
Custom markers allow any image to
be defined as a marker and be shown on a per element basis. This
feature is useful to graphically identify elements such as
specific countries with their flags or individual companies with
their logos. Now it is simple to provide enhanced readability
and additional polish to any chart type with custom markers.
Default Series
and Element
A new default
series and element allow you to make high level changes to
default settings quickly and easily. Settings can take effect
for all series on the chart, be overridden for one or more
series and then be overridden for any given elements. This
powerful new system enables you to have complete control down to
the element level when required while maintaining ease of use
and quick default settings.
Design-Time
Support
Already one of
the quickest and easiest solutions to get up and running, new
Visual Studio .NET integration enables clients using this
powerful IDE to see the chart in design time and observe the
actual rendered chart and how it changes in real-time as
settings are changed. A new wizard for Visual Studio .NET is
also in development to further extend the products ease of use
and rapid development for Visual Studio developers and will be
available at no additional charge when released.
Updated
DataEngine
Our unique
DataEngine provides powerful data manipulation and acquisition
features enabling you to chart multiple series from your own
live database in as little as 8 lines of code! Now you can
directly utilize the data engine to create derived series, split
series, limit element or derived series returns to the top
values and even aggregate “other” series or elements into a
dedicated “other” series or element. Work with SQL Statements,
Stored Procedures with parameters, Pass your own DataTable /
DataSet, or use XML – the choices are endless and you can work
with any database accessible within ASP.NET via ADO.NET. You
can even chart directly from your own excel spreadsheet!
New
DateGrouping Formatting:
You can now
have complete control over date formatting, even for
automatically generated series and elements created by the
DataEngine and DateGrouping system.
Customize
DataEngine Generated Series and Elements:
Now you have
complete control both by series and element, even when using the
advanced DataEngine functionality. Rename generated series,
manipulate data, and update settings and visuals prior to
creating the chart.
Improved
DataGrid Display Options:
You can now
control the orientation of the raw chart values for automatic
display in a custom datagrid by setting columns by element or
series. As always, you have complete control over the position
and formatting of the datagrid.
Stock Specific
DateGrouping, DataEngine and Drill Down Support:
The data engine
supports all charting types from the database / datasource with
mappings to any custom field names for expected values. In
addition to automatically charting individual elements the
DataEngine provides stock specific DateGrouping functionality.
With a given element representing as many as 5 specific values
(high, low, open, close, volume) the data engine automatically
determines an sets the appropriate values as you group by Years,
Quarters, Months, Weeks, Days, Hours and Minutes. It even
allows for completely automated stock drill down charts with the
addition of 1 simple setting.
 Chart
Area Label
Chart
Area Label
A custom label can now be set for
each chart area, enabling you to quickly and easily communicate
additional information directly within the chart image. This is
particularly useful if you have text that would normally be
included in HTML on the same page as your chart, since when the
user saves or forwards the chart image that plain text would be
lost. Yet with the new chart area label feature it becomes part
of the chart image itself. You may also control the font
attributes and color used in addition to the text value to
ensure the look and feel of your chart is exactly what you
desire.
Independent Box Controls
A new box object allow for
independent shadow, corner, label line and background
customization on a per box basis. Customize the TitleBox and
LegendBox to meet your exacting requirements with ease.
Enhanced Calculation Support
Now you can calculate new elements
or derived series based by sum, average, median, mode, minimum
and maximum. Calculations can run within a given series to
product an element or within a series collection to produce a
new series. For series calculations new support is added for
running sum, running average, running median, running mode,
running minimum and running maximum.
Enhanced Transpose Functionality
Now with a single property charts
can be transposed, visually exchanging series and element
values, without modifying the underlying data. The result is a
number of stunning and unique charts including blended
transitions. Transpose now supports all available chart types
and data combinations providing enhanced flexibility to meet
even your most demanding needs.
 Unclustered
Cylinder & Bar Support
Unclustered
Cylinder & Bar Support
Clustered cylinders & bars enable
values across multiple series to display clustered, in groups,
on a per element basis. This allows for easy comparisons between
values for a given element across multiple series. Now cylinders
and bars support a new unclustered display in 3D modes showing
each element behind the next.
Automatic Cache Subsystem
Typically charts are rendered in
real-time with each request representing different data
dynamically with different charts for each client request.
However in some cases the same charts are displayed to many
clients or the data the charts are based on is infrequently
updated. A new cache duration setting can now be used in
conjuntion with the file name setting which enables the control
to automatically determine if a new chart should be rendered or
if the previously rendered image should be returned without
further processing. The end result is a seamless scalable
caching system that enables a given chart image to render only
as required by setting one simple property.
New in version 1.4
Released 3/21/2003
 Date
Scatter Support
Date
Scatter Support
In addition to the powerful and automated date grouping
functionality, .netCHARTING now supports date scatter. This
means you can plot any arbitrary dates relative to their exact
position with automatic axis scaling. Choose between years,
quarters, months, weeks, days, hours and even minutes with one
simple setting!
Quarter & Minute Date Grouping
In addition to the extensive range of date grouping options already available, quarter and minute support has been added. Date grouping automatically aggregates values for a specific date range with no additional development or database coding required!
Gantt Charting Type
The Gantt charting type has been added with stunning 2D and 3D views. Unique to .netCHARTING is the completion indicator which provides a graphical representation of task progress and allows for visual customization.
Axis Numbering Controls
Building on the powerful automated numbering system, .netCHARTING now allows precise control over the axis numbering. Independently control the axis minimum value, maximum value and interval.Wizard / Code Generator
In addition to the extensive suite of samples provided in both C# and VB.NET the .netCHARTING wizard has been enhanced to support both C# and VB.NET code as well.
Axis Overrides
Axis mappings, or overrides, have been added which enable you to define custom labels for numeric values. For example if charting risk you may wish to use none, low, medium, and high in place of 0, 1, 2, and 3. Combined with the new axis numbering controls this feature is particularly powerful.
 Excel
Data Source Support
Excel
Data Source Support
Adding to .netCHARTING's seamlessly integrated database support
(no more writing database code!) for MS Access and SQL Server,
Excel spreadsheets are now supported. That's right, you can now
create stunning web based charts directly from your Excel
spreadsheets using .netCHARTING!
 Title
Wrapping & Legend Alignment
Title
Wrapping & Legend Alignment
For long titles the system now automatically wraps to a second
line if required. Bottom Legend alignment now supports left
justification when more than one element is included and
centering when only one element is present for ideally balanced
aesthetics.
Automated Series Generation
netCHARTING's advanced "splitby" functionality allows you to define a single series, generated from your database, and then create additional series splitting on a unique value (For example, show total sales split by customer - each customer would show with its own series). Advanced options are also provided to chart "other" elements aggregated as a single value. Now you can create a 10 series chart dynamically from your database in 6 lines of script!
 Bar
& Column Effect
Bar
& Column Effect
Version 1.4 continues to push the visual fidelity of the product
forward with a new effect available on bar and column chart
types. .netCHARTING maintains incredible ease of use with
dynamic database driven charts in a few lines of script while
providing the best looking charts of any solution, on any
platform!New in version 1.3
Released 2/17/2003
 Negative
Value Charts
Negative
Value Charts
Full negative number support has been added allowing even
complex charting types to display both negative and positive
values at the same time. This new feature has been seamlessly
integrated and takes effect automatically when negative data is
included within any series.
 Secondary
Y Axis Support
Secondary
Y Axis Support
An optional 2nd Y axis can now be added to the right side of a
chart and scales as a factor of the original Y axis. For
example, a sales chart could represent 2 different currencies by
assigning the factor to a currency exchange rate. It would then
be simple for values to be read off of the chart in either
currency by examining the appropriate Y axis.
Scatter & Bubble Axis Controls
In addition to the control provided by the AxisScale property, two new properties are provided to independently control the scales for the x and y axis for scanner and bubble charts.
 Bottom Legend Support
A new legend option is now available which allows for legend to
be placed beneath the charting area. This allows for large
series names to display cleanly without limiting the width
available for the main charting surface.
Series Order Reversal
A new property has been added that enables you to reverse the order of the charted series with 1 easy step. You also have complete control over the positions with the series level position property.
 Extruded Pie Support
A stunning new visual effect is available for 2D pie charts. In
addition to this new effect, regular 2D pies and true 3D pies
are also available.
Size Property
A new shortcut property has been added which enables you to set chart size with a single property.Chart Level ShowValues
Show values controls if the numeric values for a given element will display on the chart. This new chart level property allows for a default value to be easily controlled. You also can override this setting on a per series basis.DataGrid Series Name Support
The previous version added datagrid output support for the data values represented on the chart. Now you can also display the series names along with this data and control the name of the column used to display this data.Date Axis Formatting
The specific date time format can now be controlled for axis that are date / time based.Logarithmic Axis Scaling
The built in axis scaling options have continued to be enhanced with the addition of a logarithmic scaling option.Data Table Field Selection
You can now control the fieldnames used when passing series data in a datatable. Options are available for which field to use for the x axis data, y axis data, splitby data, and bubble size data.AddElement Enhanced
Two new options are available for adding elements to scatter and bubble charts with the addelement method.New Samples
The included samples have been updated and a new sample has been added to demonstrate creating multiple chart controls programmatically.
New
in version 1.2
Released 1/14/2003
 Scatter
Chart Type
Scatter
Chart Type
True XY scatter support has been added. This allows both the X and Y axis to plot arbitrary decimal element values. In addition to point, scatter is supported for line and spline charts.
 Bubble
Chart Type
Bubble
Chart Type
A unique new charting type which supports 3 data values per
point. Bubble works like XY scatter but also supports a third
value which controls the bubble size.
 Scatter
and Bubble Label Options
Scatter
and Bubble Label Options
With the addition of 2 new charting types, powerful new label
control options are provided including X, Y, XY, size, and XY
size.
Stored Procedure Support
In addition to the built in SqlStatement support the product now allows you to call stored procedures to obtain charting data on a per series basis. Parameters for stored procedures are also supported through the new AddParameter method. A recent addition includes support for raw datatable input on a per series basis if required..DataGrid Data Output
The included data processing engine performs grouping, aggregation and other calculations. A new DataGrid property has been provided which populates a datagrid of your choice with the tabular data represented in the chart.
 Axis
Scaling
Axis
Scaling
This new feature ensures that small variations in charting elements
are clearly visible. For example if all values were falling
between 1000 and 1010 visually you would not see much separation
with the axis starting at 0 and ending above 1000. Axis scaling
enables the chart axis to scale to the range of the points represented
in the chart so the full chart area can be used to reflect the
different element values.
 Cluster
Property
Cluster
Property
Clustering enables columns to be easily compared by placing
them next to each other in a group. This new property allows
clustering to be disabled so, for example, so columns can appear
behind each other.
Margin Settings
Complete margin controls are now provided for left, top, right and bottom. This allows you to control the amount of space or margin is left between the charting elements and the background. This can be particularly useful for implementing custom borders for your chart in conjunction with the new border background support.
 Border
Background Support
Border
Background Support
While extensive background options are already included, a new
parameter has been provided to control how background images
are handled. By default background images are titled if the
image is not large enough to fill the chart area. Now, you can
also scale the background to fit the size of the chart. This
can be useful when using the background image as a charting
border.
 Legend
and Title Box Style
Legend
and Title Box Style
New style options for the legend and titlebox enable you to
control the corners independently from cut, box, or round options.
New in version 1.1
Released 12/09/2002
 Additional
chart types
Additional
chart types
Radar and Multi-Radar have been added in both 2D and 3D views.
Great attention was paid to maintaining stunning visuals across
these unique charting types. Special labeling, shading, dot
type and line options provide complete control over the look
and feel of the Radars. Per series transparency options allow
you to highlight individual series and ensure that overlapping
series are clearly visible. Dot type options are fully supported
and allow for a variety of different symbols to be used, in
addition, their size can be controlled.
 New
outline controls
New
outline controls
The visual flexibility of .netCHARTING has continued to be expanded
with the addition of style and color controls for the TitleBox,
Legend, and Graph areas. Set outline colors and line type from
any available style independently for each separate area.
 New
line style and color settings for axis lines
New
line style and color settings for axis lines
Axis lines can now also be controlled independently with a color
and style independent of the graph area outline.
 Dot
Types are now supported on a per series level
Dot
Types are now supported on a per series level Dot
Size option
Dot
Size option New
Percentage Support
New
Percentage Support .netCHARTING
Wizard
.netCHARTING
Wizard