A treemap chart uses a hierarchical display of nested rectangles where each node of the tree gets its own area which is then further subdivided based on the nested values. By shading the rectangles with value data and examining the relative size of the rectangles, useful patterns emerge for those viewing treemaps.

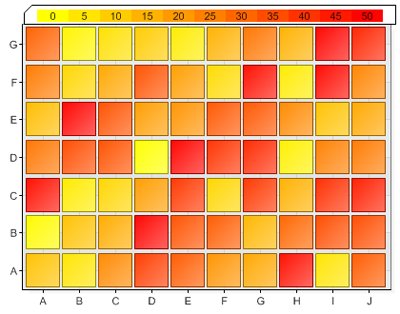
Simple heatmap charts with equally sized sections can also be created. In this case the x and y axis provide positioning data and the shading indicates value.
Furthermore, utilizing mouseovers and tooltips can identify the exact values for a given element when the user pauses over a given square.
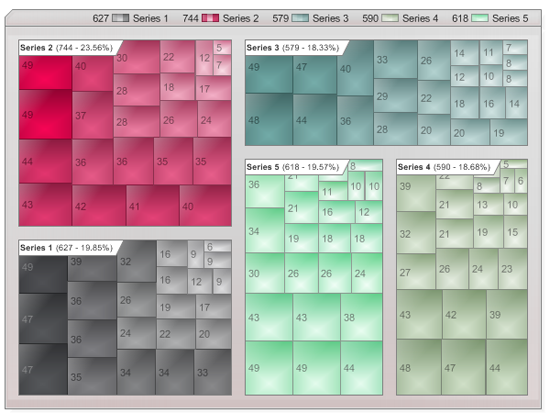
Treemaps also support shading and header customizations for the series labels. In this case, each series is shaded within a continuous color range according to the elemnt values and a template is utilized to show values including the total value for the series along with the percentage.
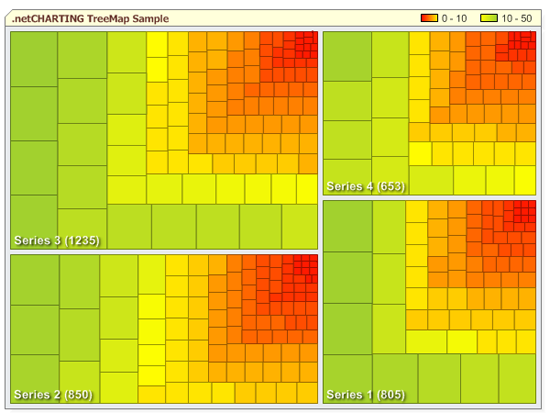
Treemap series can be labeled in customized ways including text with a drop shadow as illustrated in the sample above. In addition, small rectangles are still identifiable in a precise way through the use of tooltips.
View more ASP.NET Chart Types, Gauge and Dial Charts