.netCHARTING 4.0 adds SmartMaps™ a powerful Geographic Information Systems (GIS) based mapping type which enables the simple creation of full featured maps. SmartMaps™ enable you to bind your own data to any map, combine it with meta data included with the map itself and work with your data in a real-world coordinate system. Zoom and align your map based on real coordinates, choose map projections to alter the map view, color maps based on value ranges, size and customize markers based on data values and much more. Since SmartMaps™ use industry standard shape files you can use data from throughout the world and since it supports multiple layers, you can add additional data and image layers to your maps with ease.
The layer support also includes geo-coordinated satellite image layers for your map chart. As a result, you can create stunning composite images with a satellite image background and your own data, coloring, or labels superimposed overtop.
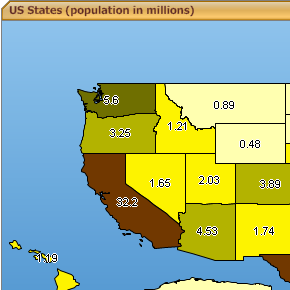
Maps are supported seamlessly with .netCHARTING so you can make use of the title box, legend box and other features you have come to depend on. In addition, thematic mapping is supported. This allows you to shade map shapes based on available data. In this case, population data is used and color ranges selected based on population value. In addition, labels with new label outline support are included to show the exact value.
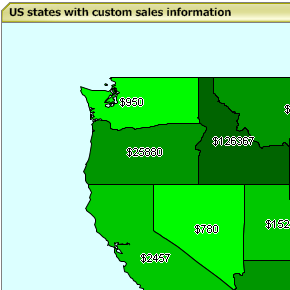
In addition to mapping information included with the map file itself, you can also bind your own data to the map from your own dynamic database. Here, sales figures are shown broken down by state. Thematic mapping is also used to shade states based on sales total ranges.
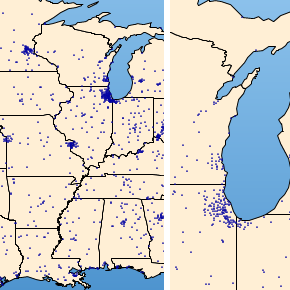
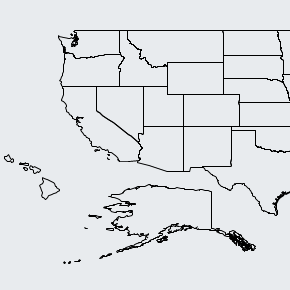
Zoom and center point features enable you to create map views showing a subset of the entire map area. Real-world coordinate support means you can take information directly from a GPS, atlas or online mapping tool to pick your zoom location. This map shows major cities and you can see how the zoomed view enhances the clarity of city groupings near the great lakes.
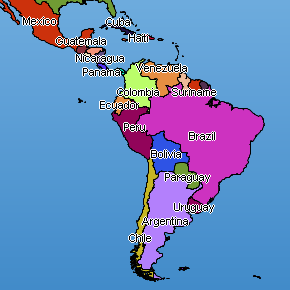
Of course, you can create map charts for any area in the world since industry standard shape files are used. Here is a map showing South and Central America. This map also demonstrates using a blended gradient background to enhance visuals.
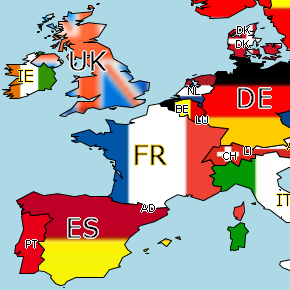
Advanced formatting options are easily accessible as each country (or any section of the map) can be customized with different label, background and fill options. Here country backgrounds are set to flag images and label sizes and formatting customized.
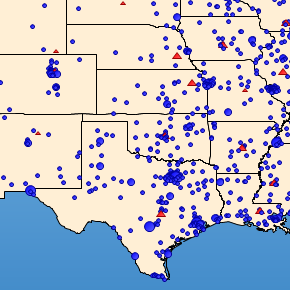
Markers can be customized based on real-world mapping data. Here, city population size is shown reflected in marker size. In addition, capital cities are shown with a red triangular marker while other cities are shown with a blue circle marker.
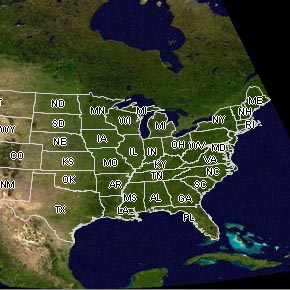
All of the power and functionality that SmartMaps™ provide to developers is easily accessible. This simple map demonstration was created in 3 lines of code!
Chart.Type = ChartType.Map
Chart.TempDirectory = "temp"
Chart.Mapping.MapLayerCollection.Add("primusa.shp")
Yes, that is all that is required to create a map using SmartMaps™.
Powerful label and background formatting options enable you to tune the look and feel of the map using simple properties. Here, the label outline and color are adjusted, state color is set and online color is also changed.
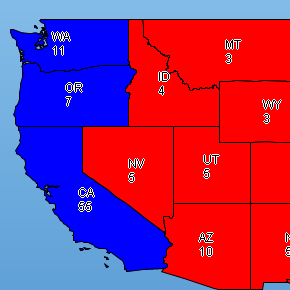
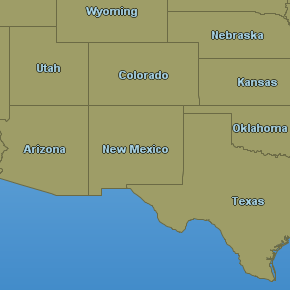
Here, thematic mapping shows voting results and uses custom label formatting to display both state code and winning count. States are colored based on winning party.
All of the samples shown above are included in the free developer version of .netCHARTING, download it today and experience SmartMaps™ for yourself!
View more ASP.NET Chart Types, View Pie and Donut Charts, Gauge and Dial Charts