The Concept
Multiple ChartAreas are a 'smart' feature, hence, the concept here is to have the chart engine do the thinking for you. All you have to do is create some series, specify which axes you want them to use, and which chart areas the series should be placed in. Then the chart engine will take over and lay out the chart areas based on the axis relationships between your series. The 'Layout' section will demonstrate this smart behavior.
Another approach is to specify the axes for chart areas instead of series, in which case the series will acquire the axes of the chart areas they are placed in.
Main / Default Chart Area
Every chart starts with the main chart area. It is referenced through Chart.ChartArea. Properties such as Chart.TitleBox and Chart.LegendBox refer to this area’s title and legend boxes so using Chart.ChartArea.TitleBox and Chart.ChartArea.LegendBox will have the same effect as the two previous properties. They are there simply as shortcuts. There is also a default chart area [Chart.DefaultChartArea]. Even though it is the same object as the main area, it is not used in the same manner. This object provides a vehicle for properties that will propagate to all other chart areas on a chart image automatically. If you would like to set a standard background color of all the chart areas quickly, you would set it through DefaultChartArea.
Adding Areas
Adding chart areas is simple. One must be instantiated and then added to the chart’s ExtraChartAreas collection.
[C#]ChartArea ca1 = new ChartArea();
Chart.ExtraChartAreas.Add(ca1);
[Visual Basic]Dim ca1 As New ChartArea()
Chart.ExtraChartAreas.Add(ca1)
This of course will give you an empty chart area. To make use of it, it will also need data to display.
[C#]ca1.SeriesCollection.Add(mySeries);
[Visual Basic]ca1.SeriesCollection.Add(mySeries)
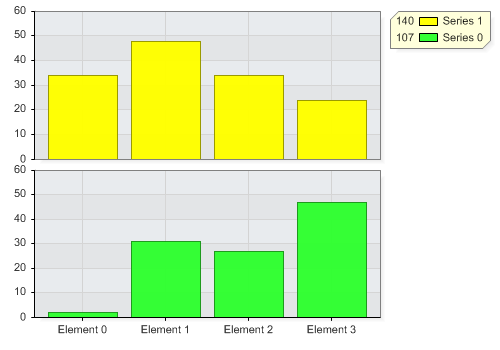
At this point you may end up with a chart that looks like this.

Sizing
These 2 charts will be laid out vertically for reasons we’ll get to in a moment. At this stage you can control the layout by specifying what percentage of the full height a particular chart area should occupy. We’ll set the second area’s height to 20%.
[C#]ca1.HeightPercentage = 20;
[Visual Basic]ca1.HeightPercentage = 20
This will draw the second chart area at 20% and the main chart area at 80% height.

If there were three or more areas the other two would equally divide up the remaining space.
 |
Sample: ChartAreaSizing.aspx |
Axis Relationships
This may be the most complex concept initially but it builds on top of series-axis relationships which you may already be familiar with.
Each new chart area you add will not automatically have x and y axis instances. These axes will be provided by the series added to chart areas and since by default all series use the main x and y axis pair, all areas will share the same x and y axis pair. In the 'Adding Areas' section above you can clearly see that the x axis is shared and so it the y axis, however, it is drawn twice and even though it's the same axis, by default the scale will not remain the same. On the other hand, if the same axis is drawn once across multiple areas like the x axis in the above example then obviously the scale will remain the same.
To preserve the axis scale when it is redrawn, you must set the Axis.SynchronizeScale.PreserveScale property to true.
[C#]Chart.YAxis.SynchronizeScale.PreserveScale = true;
[Visual Basic]Chart.YAxis.SynchronizeScale.PreserveScale = True

One way to visualize the axis sharing concept is to pretend the two series are in a single combo chart area, you then make a carbon copy of the chart and erase one of the series from each area.
 |
Setting a property for a new chart area's axis will instantiate a new axis for the area. So doing: will create a new axis for myChartArea and the series within it will inherit this new y axis unless they have axes specified already. |
Simple enough right?
Layout
If we take the example above but assign a new x axis, the chart areas will be positioned horizontally.
[C#]ca1.XAxis = new Axis();
[Visual Basic]ca1.XAxis = New Axis()

This happens because .netCHARTING automatically tries to position chart areas based on axis relationships. In the first example both x and y axes were the same but only the x axis was drawn once across both areas. Because the axis cant be in two places at the same time, it is redrawn. The decision of which axes to draw only once was based on the setting:
[C#]Chart.ChartAreaLayout.Mode = ChartAreaLayoutMode.VerticalPriority;
[Visual Basic]Chart.ChartAreaLayout.Mode = ChartAreaLayoutMode.VerticalPriority
This is the default behavior. If we prefer the areas use the y axis across both areas instead of x and without assigning a new axis to the chart area, the following setting can be used:
[C#]Chart.ChartAreaLayout.Mode = ChartAreaLayoutMode.HorizontalPriority;
[Visual Basic]Chart.ChartAreaLayout.Mode = ChartAreaLayoutMode.HorizontalPriority
Now that we’re getting the hang of using chart areas and positioning them, let’s further explore this functionality .
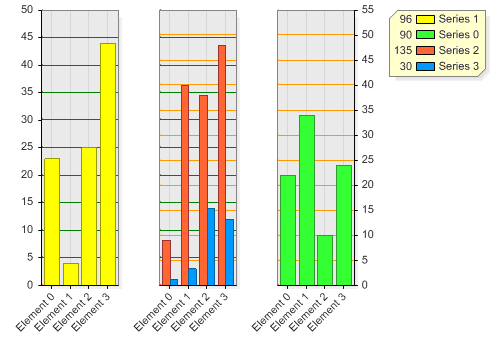
Say we want two Y axes on three chart areas. Area A will contain a single series with one y axis, area b, a series with the other y axis and area c will contain two series, each with one of the y axes.
Something like this:
Area A:
Series1.YAxis = YAxisOne
Area B:
Series2.YAxis = YAxisTwo
Area C:
Series3.YAxis = YAxisOne
Series4.YAxis = YAxisTwo
The Code:
[C#]
SeriesCollection mySC = [….];
Axis a1 = new Axis();
Axis a2 = new Axis();
a1.DefaultTick.GridLine.Color = Color.Orange;
a1.Orientation = Orientation.Right;
a2.DefaultTick.GridLine.Color = Color.Green;
ChartArea ca1 = new ChartArea();
ChartArea ca2 = new ChartArea();ca1.SeriesCollection.Add(mySC[0]);
ca2.SeriesCollection.Add(mySC[2], mySC[3]);
Chart.SeriesCollection.Add(mySC[1]);
mySC[0].YAxis = a1;
mySC[1].YAxis = a2;
mySC[2].YAxis = a1;
mySC[3].YAxis = a2;
[Visual Basic]
Dim mySC As [….] ' Some series collection
Dim a1 As New Axis()
Dim a2 As New Axis()
a1.DefaultTick.GridLine.Color = Color.Orange
a1.Orientation = Orientation.Right
a2.DefaultTick.GridLine.Color = Color.Green
Dim ca1 As New ChartArea()
Dim ca2 As New ChartArea()ca1.SeriesCollection.Add(mySC(0))
ca2.SeriesCollection.Add(mySC(2), mySC(3))
Chart.SeriesCollection.Add(mySC(1))
mySC[0].YAxis = a1
mySC[1].YAxis = a
mySC[2].YAxis = a1
mySC[3].YAxis = a2
 |
Sample: ChartAreaRelationships.aspx |

 |
Quick Note: The axis with orange grid lines was oriented on the right. If it were oriented to the left it would be placed on the left most area that uses it. |
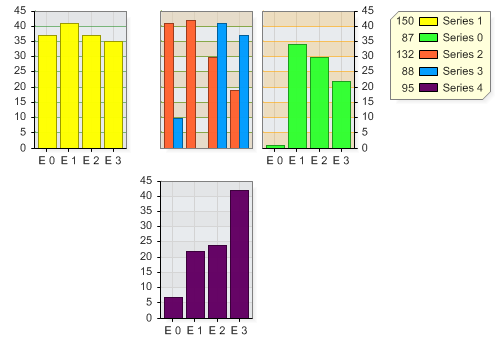
The logic behind the mechanism is as follows: Using HorizontalPriority, a group of charts is put together based on their y axis relationships and placed on the first row. Then another group of y axis related areas is placed in the next row, however, they are re-arranged to maintain the maximum x axis relationships between chart areas. So while horizontal relationships are the priority, smart logic is also involved in vertical axis relationships.
[C#]ChartArea ca3 = new ChartArea();ca3.SeriesCollection.Add(mySC[4]);
ca3.XAxis = new Axis();
ca2.XAxis = ca3.XAxis;
[Visual Basic]ChartArea ca3 = new ChartArea();ca3.SeriesCollection.Add(mySC[4]);
ca3.XAxis = new Axis();
ca2.XAxis = ca3.XAxis;

As you can see, the areas are laid out correctly based on the axis relationships we specified.
Other modes include:
- HorizontalSmart
- VerticalSmart
These are similar to their ‘priority’ counterparts. The layout logic is still in use; however, all areas will be placed in a single row or column respectively.
The last mode, Custom, provides full control of chart area positioning.
[C#]Chart.ChartAreaLayout.Mode = ChartAreaLayoutMode.Custom;
ChartArea.GridPosition = new Point(0,0);
ChartArea2.GridPosition = new Point(0,1);
[Visual Basic]Chart.ChartAreaLayout.Mode = ChartAreaLayoutMode.Custom;
ChartArea.GridPosition = new Point(0,0)
ChartArea2.GridPosition = new Point(0,1)

 |
Sample: ChartAreaCustomLayout.aspx |
This system is a new concept in the charting world. To get the most out of try not to focus on the chart area layout but on the data you're charting and the chart engine will do the rest. If you stumble upon an ingenious way of using this system please let us know. We would love to hear about it and share your achievements with the masses.
Personal Legend boxes
See: LegendBox Advanced Tutorial


