Introduction
This section will go over a number of issues that affect the performance of chart rendering. Please note that these tips are not necessarily required in normal scenarios. They are shown here in order to improve performance when it is crucial. There are several things to consider when creating charts that require high availability and performance.
 |
WinForms Performance When a WinForms application is run in debug mode with Visual Studio, it executes the app.vshost.exe application in the bin folder and runs much slower than the app.exe file which is also available in the bin folder. |
Charts with less than 200 Elements.
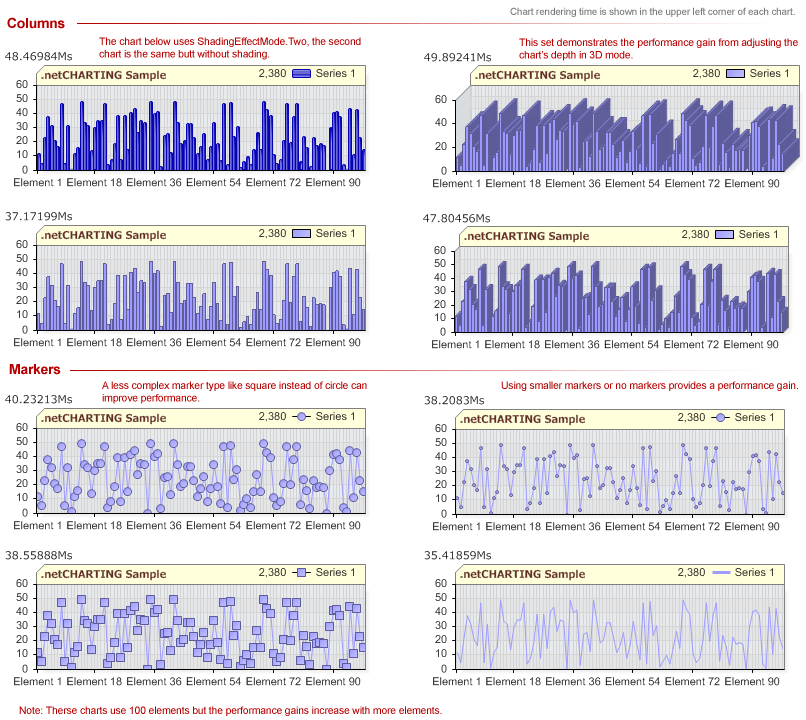
When there are few data elements on a chart, the data processing time is largely minimal. Drawing the image takes the majority of time. The more fancy the chart, the slower it will render. Not to say that charts render showily, however, in certain circumstances every millisecond counts. So, how can this process be sped up? Consider this, everything that is drawn on a chart requires time and the more complicated the drawing (shading effects, gradients, shadows etc.) the longer it takes.
Another very important fact to consider is the chart size. The larger the chart becomes the longer it will take for GDI to generate it. There is however an exception to this rule. When charts are so small that they have to be scaled down to fit into the image they are actually drawn at a larger size than specified, then scaled down so this will require more processing time. You'll be able to tell how much a chart is scaled by looking at text labels and compare their size to non-scaled versions of the chart.
The following chart grid demonstrates the performance impact of some settings.

 |
Tips & Summary
|
Charts with 200+ elements.
With a large number of elements the performance scale begins to tip towards data processing. Certain element features may take a few extra cpu ticks due to processing such as token replacement for element tool tips, labels and other hotspot attributes. The more tokens used in element properties the longer processing may take. Using element markers for series with thousands of elements might also be a bad idea because each marker must be drawn individually.
Memory performance.
If memory usage is a factor there are a few things to be aware of. First, memory usage can be tweaked only when charts are showing a large number of elements, otherwise, these tips will provide marginal benefits.
Element properties such as smart label, markers and hotspots are not instantiated by default. They are instantiated when the properties of those objects are used. For instance using code such as: Chart.DefaultElement.SmartLabel.Text = "%Name" will create a SmartLabel instance for the default element and eventually for each element on the chart.


