Intro
JSCharting is a javascript based charting layer. It works similar to zoomer and navigator but uses only javascript to render the chart client side. This allows real-time updates of chart properties and data. It uses SVG and VML graphics technologies to increase browser compatibility and chart interactivity which yields a richer experience on devices such as phones and tablets running iOS, Android and more.
Benefits:
- Browser Compatibility
- Renders Client-Side
- Real-Time updates
- Interactivity
- Animation
- Javascript based events.
- Touch-Screen support.
It is easy to use, by simply setting Chart.JS.Enabled = true a pure javascript chart will render in place of static chart images.
JSCharting is a subset of the full DNC library but many of the more important features are supported. The feature differences are discussed in more detail below.
What's new in v9.2
Version 9.2 includes many new features including microcharts and mosaic plots. Some new features include:
- Microchart Visualizations
- Mosaic Plot/Variwide/Mekko chart type
- Interactive UiItem types
- Crosshairs
- Axis scale break enhancements
- Data Point Options
What's new in v9.1
Version 9.1 includes many new features and enhancements. Some new features include:
- Calendar Heatmap
- Calendar Views
- Label html tag improvements
- Vector Icon support through the icon text tag
- Box layout system
- CSV loading client side
- Client side SmartLabels
What's new in v9.0
Version 9.0 is a major update to JS chart engine that brings JavaScript output much closer to feature parity with image charts. Some new features include:
- Circular Bar Gauges
- Circular Overflow Indication
- Linear Gauges
- Hatch Styling
- Column Complete Visualization
- Organizational Chart Type
- Heatmap Chart Type
- TreeMap Cushion Shading
- Custom Legend Entries
- Legend Template
- Legend AxisMarker Entries
- Markers for all Series Types
- Icon Browser
- Icon Support in any Label
- Multiple Shape Labels
- SmartPalette Legend Support
- Axis Line Breaks
- Box Corner Styling
What's new in v8.4
Version 8.4 introduces a number of features including Gantt support. Some new features include:
- Time Y Axis
- Dynamic Token Tick and AxisMarker Values
- Custom Ticks
- Logarithmic Scale
What's new in v8.3
Version 8.3 introduces a new simpler way of working with map charts. Some new features include:
- Map context shows surrounding maps automatically
- Custom map files using geoJSON and topoJSON (optional)
- Add map layers in real-time for advanced dynamic maps
- Plot lines, markers, and bubbles on maps.
What's new in v8.2
Version 8.2 introduces a number of new chart types and improved axis features. Some new features include:
- Funnel/Pyramid/Code/Treemap Types - Powerful new pyramid, funnel and cone charts are now supported in JSC as single charts or groups of charts within a given chart area.
- Smart Scale Breaks - JSC can now understand smart scale break settings the dynamically calculate the best breaks as series data or visibility changes.
What's new in v8.1
Version 8.1 introduces a number of new chart types and more robust label support. Some new features include:
- Label Tokens - Richer token support is not available.
- Label Expressions - Labels using expressions can now be used on js charts to create dynamic content.
- Circular Gauge Type - The traditional circular gauge types are now available.
- Radars - Radar charts are supported with any series types. JSCharting also allows bar shading effects on radars which is not supported by image charts.
- Pie Lengths - The pie length variation between slices is not supported with js charts.
- Pie Angles - Starting pie angle support.
- Range Columns/Areas - Columns and area series types now support starting values.
- Error Bars - Subvalues that create error bars will work with JSCharting.
What's new in v8.0
Version 8.0 is a major update to the previous JSCharting implementation. Some new features include:
- Label Tokens and formatting are practically in feature parity with image charts
- JS Navigator for finance charts and zooming.
- Client side API for JS charts closely matches DNC API that makes reading the generated JS code easier.
- The new version of JSC is much easier to work with client-side.
 |
This new version introduces a new client side API, if existing charts are using JS to manipulate the chart, this code may have to be modified. |
Supported features
- Export to raster and vector images
- Printing support
- Element Selection
- Series Visibility
- Zooming
- Tooltips
- Label tokens
- Label Expressions
- Label Callbacks
- Native formatting
- Client Side Programming
-
- Formatting
- Token evaluation
- JS Navigator
-
- Multiple chart areas
- Chart Types
-
- Combo
- ComboHorizontal
- Pie
- Pies
- PiesNested
- Donut
- Donuts
- Gauges
- Radars
- Funnel
- Pyramid
- Cone
- Treemap
- Series Types
-
- Bar/Column
- Range Bar/Column
- Error Bars
- Line
- Spline
- AreaLine
- AreaSpline
- Range AreaLine
- Range AreaSpline
- Marker
- Bubble
- Candlestick (Using JS Navigator)
- OHLC Bars (Using JS Navigator)
- Pie slice length.
- Pie starting angles
- Real-Time updating
User Interface (UI)
The JSCharting user interface is inherently more interactive and dynamic. It offers a number of features described below.
|
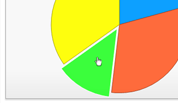
Tooltips Element Highlighting on Hover |
 |
|
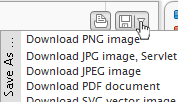
Export / Print buttons |
 |
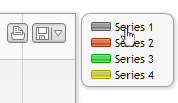
| Legend Entries The legend entries are clickable to hide series in any JSCharting chart. |
 |
|
Element selection |
 |
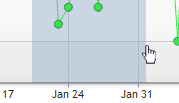
| Zooming Dynamic zooming is also available when enabled. It allows the user to zoom in and out of the charts range. |
 |
Server Side Programming Interface (API)
JSCharting is driven by the current .netCHARTING API. Simply enabling JSCharting will render the chart in the client-side browser instead of generating an image on the server. JSCharting offers the ability to interact with the chart in the browser through Javascript.
Enabling JSCharting
To enable JSCharting, the following code can be used:
[C#]

Chart.JS.Enabled = true;
[Visual Basic]

Chart.JS.Enabled = true
Initial Animation
When JSCharting loads, it animates the series drawing. The duration of this animation can be specified in milliseconds and set as in the following code snippet:
[C#]

Chart.JS.InitialAnimationDuration = 1000;
[Visual Basic]

Chart.JS.InitialAnimationDuration = 1000
Element Selection
Element selection can be enabled or disabled with the following code:
[C#]

Chart.JS.EnableElementSelection = true;
[Visual Basic]Chart.JS.EnableElementSelection = true
Zooming
To enable zooming for a javascript chart, the Chart.JS.AxisToZoom property can be utilized. It takes a string with possible values of: "X", "Y", "XY".
[C#]

Chart.JS.AxisToZoom = "X";
[Visual Basic]

Chart.JS.AxisToZoom = "X"
 |
See Sample: JSCZooming |
Client Side Programming Interface (API)
JSCharting can interact with Javascript in the browser to update dynamically and notify other javascript code of chart based events.
In order to interact JSCharting, a control ID must be specified for the chart on the server side so it can be referred to in javascript. The following code can be used to achieve this:
[C#]

Chart.JS.ControlID = "jscChart";
[Visual Basic]Chart.JS.ControlID = "jscChart"
The following Javascript snippets assumes the above control id setting is used.
Reading the JS output
When Chart.Debug=true, the generated JS will be legible. When debug is disabled, whitespace is removed.
Unsupported JS settings
There are a few JS API settings that cannot be set through the DNC API such as point states like hover and selected. For this and other such cases, a method is provided that applies settings given a path a value.
[C#]

Chart.JS.Settings.Add("defaultSeries.defaultPoint.states.hover.outline.color", "red");
[Visual Basic]

Chart.JS.Settings.Add("defaultSeries.defaultPoint.states.hover.outline.color", "red")
This method takes only strings values, however, any type can be specified. If a value of "true" is passed, it will be a boolean in JS. To use a string with that value, use "'true'" with single quotes. The same applies to numbers. If a JS variable that holds the value in JS must be referenced, prefix the string with "js:". This will prevent quote wrapping and will be used in JS as is. For example, if in JS there is a variable defined as var colorRed = 'red'; to refer to this variable in a string setting server side, use "js:colorRed". This allows passing functions as well for cases like label callbacks. For example: "js:function(txt){return 'text:'+txt}"
 |
See Sample: JSCSettings JSCLabelCallbacks |
Axis and AxisMarkers
 |
The following axis related javascript usage is demonstrated in sample: JscDynamicStylingUpdates |
Getting Axis and Data Scale Ranges
First, the Chart.JS.ControlID must be specified, and an ID must be assigned to the axis server side.
[C#]

Chart.JS.ControlID = "JscChart";
Chart.YAxis.JsID = "axy";
Chart.XAxis.JsID = "axx";
[Visual Basic]

Chart.JS.ControlID = "JscChart"
Chart.YAxis.JsID = "axy"
Chart.XAxis.JsID = "axx";
var range= JscChart.axes('axy').getRange();
This returns a value such as:{ min:0, max:100, dataMin:5, dataMax:80}
The result contains the following values:
range.min - Axis scale minimum.
range.max - Axis scale maximum.
range.dataMin - Data scale range minimum.
range.dataMax - Data scale range maximum.
Setting Axis Scale Range
Similar code can be used to apply a new axis scale range.
JscChart.axes('axy').zoom(0,2);
To set a date time based scale, use:
JscChart.axes('axy').zoom(new Date(2011, 0, 2), new Date(2011, 0, 5));
Adding and Removing Axis Markers dynamically.
Axis markers can be added and removed in realtime through Javascript.
The following code snippet adds a range axis marker to the x axis.
JscChart.axes('axx').markers.add({
value:[new Date(2011, 0, 2),new Date(2011, 0, 5)],
color: '#ACFFC5',
id: 'am1'
});
In order to add and remove a single value axis marker which draws as a line instead of an area, the following code can be used.
JscChart.axes('axx').markers.add({
value: new Date(2011, 0, 2),
color: '#ACFFC5', lineWidth:2,
id: 'am1'
});;
To remove this axis marker, the following code can be used:
JscChart.axes('axx').markers('am1').remove();
Real-Time Data Update
Adding a point to a series
To add a point to a series in real time the following javascript function can be used.
series.points.add( pointOptions, { [ shift ], [ animation ] })
PointOptions - Takes an array, or point object. If it is an array, it will be interpreted as x and y values respectively.
The point object contains the following basic properties:
- color
- name
- x
- y
- id
shift - When shift is true, one point is shifted off the start of the series as one is appended to the end. Use this option for live charts monitoring a value over time.
animation - true/ false, or the animation duration in milliseconds.
 |
Note: The series must be assigned an ID server side in order to refer to it later. |
var series = c
series.points.add([2, 6]);
To use a point object the follwing code can be used:
var series = JscChart.series('s1');
series.points.add({
color: 'Red'
x: 2,
y: 6
});
The series object has the following available functions:
- remove()
- select(bool select, bool accumulate)
select - When true, the point is selected. When false, the point is unselected. When null or undefined, the selection state is toggled.
accumulate - When true, the selection is added to other selected points. When false, other selected points are deselected. Internally in Highcharts, selected points are accumulated on Control, Shift or Cmd clicking the point. - options( seriesOptions )
seriesOptions - All series options can be updated through this function.
-
remove( ) - Removes the series from the chart.
Adding a series to a chart
To add a new series to a chart the following type of code snippet can be used:
JscChart.series.add({
points: [194.1, 95.6, 54.4, 29.9, 71.5]
});
 |
See sample JscLiveDataUpdate for an example of how points are added to a chart in javascript. |
Get a Selected Point
To get the points currectly selected the follwing code can be used:
var selectedPoints = JscChart.series().points({selected:true})
This returns a collection of selected point objects which can be filtered/iterated further.
The point object has the following available functions:
- remove()
- select(bool select, bool accumulate)
select - When true, the point is selected. When false, the point is unselected. When null or undefined, the selection state is toggled.
accumulate - When true, the selection is added to other selected points. When false, other selected points are deselected. Internally in Highcharts, selected points are accumulated on Control, Shift or Cmd clicking the point. - options( pointOptions )
pointOptions - The setting this point will be updated with.
-
zoomTo( ) - Zooms the related point into view.
The JS point object has the following properties:
- chart- A reference to the parent JS chart object.
- series - A reference to the parent JS series object.
- name - The name of this point.
- id- The point's ID.
- x - The x value.
- y - The y value.
Client-Side Token Parsing
The chart, series, and point objects have the following two functions that allow evaluating tokens client side. The replaceTokens('string with tokens') function processes tokens associated with the point, series, or chart (SeriesCollection) and returns a string. The tokenValue('token') function accepts only one token name and returns the value as its native type. For example calling series.replaceTokens( '%average') will return a string such as "12". However, calling tokenValue('%average') will return the number 12.
The chart version of these two methods also has an optional id parameter. If not specified, the tokens are evaluated against all the series on the chart. If an id value is specified, the tokens are based on the target's type be it a point or series.
Events
Events can be specified server side through the hotspot class and include javascript handlers.
The following code snippet sets a click event handler for the chart and includes a function that adds a point at the clicked location to the chart.
[C#]

Chart.DefaultElement.Hotspot.Attributes.Custom.Add("click", "js: function(){if (this.series.points.length > 1) this.remove();}");
[Visual Basic]Chart.DefaultElement.Hotspot.Attributes.Custom.Add("click", "js: function(){if (this.series.points.length > 1) this.remove();}")
When adding the click event, a function handler with one parameter can be used. The parameter contains the click event information. The above shows how to get the clicked axis values based on the event. The 'this' keyword refers to the javascript chart object.
 |
When using a setting for JSC, prefixing the string value with "js:" indicates the string should be treated as a JS literal. Some label text settings can include js callback functions to process the text when needed. |
 |
See sample JscClickAddPoint for an example. |
Chart level events
- click (fires when the chart is clicked)
Keyword this refers to the chart object.
One parameter 'event' is pased to a JS function handler. event.xAxis and event.yAxis contain arrays of axes on the chart. - addSeries (Fires when a series is added to the chart)
Keyword this refers to the chart object.
One parameter 'event' is pased to a JS function handler. event.options gives access to the series being added to the chart. - selection (fires when an area of the chart has been selected 'zooming')
Keyword this refers to the chart object.
One parameter 'event' is pased to a JS function handler.
event.preventDefault() will stop the zooming from occuring.
event.xAxis and event.yAxis contain arrays of axes on the chart.
Events can be specified for an element as well. The following code snippet adds a handler to elements that removes them when clicked:
[C#]

Chart.DefaultElement.Hotspot.Attributes.Custom.Add("click", "if (this.series.data.length > 1) this.remove();");
[Visual Basic]Chart.DefaultElement.Hotspot.Attributes.Custom.Add("click", "if (this.series.data.length > 1) this.remove();")
 |
See sample JscClickAddPoint for an example. |
Element level Events
- click (fires when an element is clicked)
Keyword this refers to the element object.
One parameter 'event' is pased to a JS function handler. - mouseOver (fires when the mouse hovers an element)
Keyword this refers to the element object.
One parameter 'event' is pased to a JS function handler. - mouseOut (fires when the mouse leaves an element)
Keyword this refers to the element object.
One parameter 'event' is pased to a JS function handler. - remove (fires when the element is removed)
Keyword this refers to the element object.
One parameter 'event' is pased to a JS function handler. - select (fires when the element is selected)
Keyword this refers to the element object.
One parameter 'event' is pased to a JS function handler. - unselect (fires when the element is unselected)
Keyword this refers to the element object.
One parameter 'event' is pased to a JS function handler. - update (fires when the element is updated programatically)
Keyword this refers to the element object.
One parameter 'event' is pased to a JS function handler.


