Introduction
A Calculated axis is a Shadow Axis that mimics another axis that already exists but with a change in behavior.
The different behavioral changes and forms of shadow axes are:
- Numeric Unit Conversion
- Time Interval Conversion
- Custom tick label manipulation delegate method
- Completely custom replica axis.
 |
Calculated axes do not fill alternating grid areas. |
Unit Conversion
.netCHARTING is equipped with calculations for converting between 1092 different units. If you have an axis with a scale that represents some measure, it can be easily converted to another unit. For example feet to inches and so on.
The process for adding a calculated axis is simple:
- Instantiate a calculated axis by calling the Calculate method of an existing axis.
- Add it to the Chart.AxisCollection collection.
[C#]Axis inchAxis = Chart.YAxis.Calculate("Inches",Length.Feet, Length.Inch);
Chart.AxisCollection.Add(inchAxis);
[Visual Basic]Dim inchAxis As Axis = Chart.YAxis.Calculate("Inches",Length.Feet, Length.Inch)
Chart.AxisCollection.Add(inchAxis)
That is all. The axis will automatically show up on the chart by the original axis.
 |
Do not add axes to AxisCollection that are not calculated axes. See Axis Tutorial > Multiple Axes for information on how additional axes can be used. |
There is another feature worth discussing. The new converted unit axis will by default take the parent axis ticks and convert them to the specified unit. The refresh scale option will allow the axis to come up with its own intervals. They will not match the parent axis tick positions exactly but will behave as if it is the original axis. This option is specified in the Calculate method as a parameter and illustrated below.

 |
Sample: interactiveUnitConversion.aspx |
Time Interval Conversion
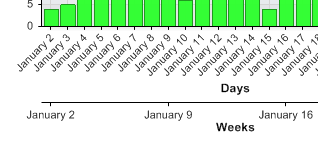
This type of conversion allows the resulting axis to show different time intervals than the original axis. For example, the first axis can show days and the calculated axis can show weeks.
[C#]Chart.XAxis.TimeInterval = TimeInterval.Days;
Chart.XAxis.Label.Text = "Days";
Chart.AxisCollection.Add(Chart.XAxis.Calculate("Weeks",TimeInterval.Weeks));
[Visual Basic]Chart.XAxis.TimeInterval = TimeInterval.Days
Chart.XAxis.Label.Text = "Days"
Chart.AxisCollection.Add(Chart.XAxis.Calculate("Weeks",TimeInterval.Weeks))

 |
Sample: CalculatedTimeAxis.aspx |
Custom Tick Label Manipulation Method
The third conversion requires a custom delegate method that takes a string and returns a processed string. This gives you full control over the axis tick label text if necessary.
 |
Sample: customFunction.aspx |
 |
To only show the calculated axis on the chart and not it's parent, use ParentAxis.Clear() to make it disappear as shown in the customFunction.aspx sample. |
[C#]Axis axisReplica = Chart.XAxis.Calculate("Replica");
Chart.AxisCollection.Add(axisReplica);
[Visual Basic]Dim axisReplica As Axis = Chart.XAxis.Calculate("Replica")
Chart.AxisCollection.Add(axisReplica)
 |
Some possible uses of this type of shadow axis are shown in the following samples.
|
After reviewing the above samples you will see that this feature can be useful, however, don't limit yourself to the demonstrated possibilities. The dynamic nature of this feature allows for countless different ways to better describe your data you're plotting.
Tutorials
Axis Calculated Ticks


